
| Export of goods from Finland and import to Finland | Trade Balance |
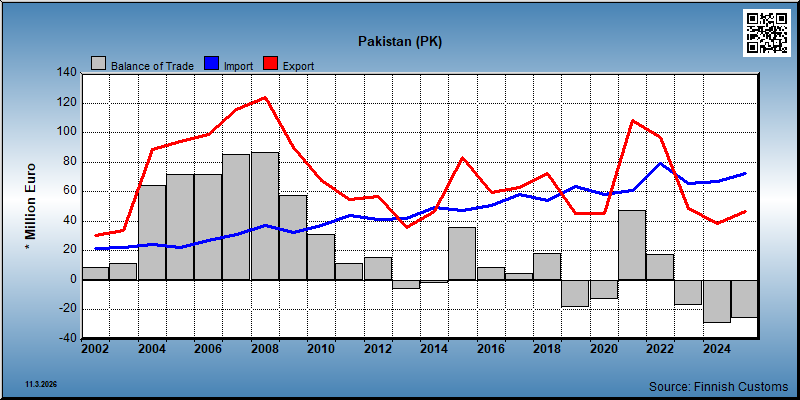
| Year | Import 1,000 € | Export 1,000 € | Trade 1,000 € | Trade balance 1,000 € |
|---|---|---|---|---|
| 2002 | 21,464 | 30,173 | 51,637 | 8,709 |
| 2003 | 22,498 | 33,634 | 56,132 | 11,136 |
| 2004 | 24,418 | 88,443 | 112,861 | 64,025 |
| 2005 | 22,341 | 94,067 | 116,408 | 71,726 |
| 2006 | 26,878 | 98,386 | 125,264 | 71,507 |
| 2007 | 30,751 | 115,694 | 146,445 | 84,943 |
| 2008 | 37,372 | 123,710 | 161,083 | 86,338 |
| 2009 | 32,604 | 90,128 | 122,732 | 57,524 |
| 2010 | 36,908 | 67,916 | 104,825 | 31,008 |
| 2011 | 43,585 | 54,783 | 98,368 | 11,198 |
| 2012 | 41,021 | 56,744 | 97,764 | 15,723 |
| 2013 | 41,968 | 35,531 | 77,499 | -6,437 |
| 2014 | 49,194 | 46,836 | 96,030 | -2,357 |
| 2015 | 47,522 | 83,260 | 130,782 | 35,738 |
| 2016 | 50,763 | 59,733 | 110,496 | 8,970 |
| 2017 | 57,904 | 62,740 | 120,644 | 4,837 |
| 2018 | 54,092 | 72,150 | 126,242 | 18,058 |
| 2019 | 63,569 | 45,261 | 108,830 | -18,308 |
| 2020 | 58,459 | 45,454 | 103,912 | -13,005 |
| 2021 | 61,048 | 108,195 | 169,243 | 47,147 |
| 2022 | 79,287 | 96,501 | 175,788 | 17,213 |
| 2023 | 65,454 | 48,409 | 113,863 | -17,046 |
| 2024 | 67,246 | 38,387 | 105,634 | -28,859 |
| 2025 | 72,399 | 46,883 | 119,282 | -25,515 |
*) SITC = Standard International Trade Classification (classification system is maintained by the United Nations)
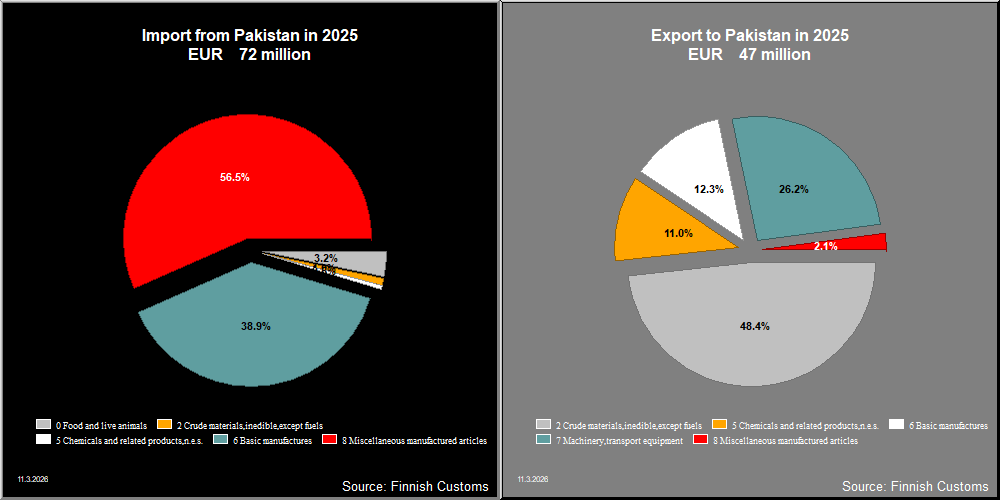

| 2021 | 2022 | 2023 | 2024 | 2025 | ||||||
|---|---|---|---|---|---|---|---|---|---|---|
| 1,000 € | % | 1,000 € | % | 1,000 € | % | 1,000 € | % | 1,000 € | % | |
| 0. Food and live animals | 82 | 0.1 | 125 | 0.1 | 320 | 0.7 | 39 | 0.1 | 132 | 0.3 |
| 04. Cereals and cereal preparations | 22 | 0.0 | ||||||||
| 07. Coffee,tea,cocoa,spices | 117 | 0.1 | 319 | 0.7 | 51 | 0.1 | ||||
| 08. Feeding stuff for animals | 50 | 0.0 | 39 | 0.1 | 81 | 0.2 | ||||
| 09. Miscellaneous edible products and preparations | 10 | 0.0 | 9 | 0.0 | ||||||
| 2. Crude materials,inedible,except fuels | 34,123 | 31.5 | 47,240 | 48.9 | 24,173 | 49.9 | 17,245 | 44.9 | 22,628 | 48.3 |
| 21. Hides,skins,furskins,raw | 63 | 0.1 | ||||||||
| 23. Crude rubber (incl.synthetic) | 1 | 0.0 | ||||||||
| 24. Cork and wood | 1,820 | 1.7 | 2,171 | 2.2 | 2,767 | 5.7 | 2,918 | 7.6 | 4,701 | 10.0 |
| 25. Pulp and waste paper | 7,359 | 6.8 | 9,327 | 9.7 | 4,892 | 10.1 | 3,771 | 9.8 | 5,727 | 12.2 |
| 26. Textile fibres and their wastes | 11 | 0.0 | 8 | 0.0 | 13 | 0.0 | 6 | 0.0 | 1 | 0.0 |
| 27. Crude fertilizers and crude minerals | 530 | 0.5 | 351 | 0.4 | 218 | 0.4 | 189 | 0.5 | 380 | 0.8 |
| 28. Metalliferous ores and metal scrap | 24,403 | 22.6 | 35,381 | 36.6 | 16,283 | 33.6 | 10,360 | 27.0 | 11,757 | 25.1 |
| 5. Chemicals and related products,n.e.s. | 6,483 | 6.0 | 5,781 | 6.0 | 7,367 | 15.2 | 7,630 | 19.9 | 5,139 | 11.0 |
| 51. Organic chemicals | 1,060 | 1.0 | 67 | 0.1 | 3,228 | 6.7 | 3,514 | 9.2 | 3,006 | 6.4 |
| 52. Inorganic chemicals | 183 | 0.2 | 214 | 0.2 | 137 | 0.3 | 68 | 0.2 | 2 | 0.0 |
| 53. Dyeing,tanning and colouring material | 160 | 0.1 | 40 | 0.0 | 99 | 0.2 | 80 | 0.2 | ||
| 54. Medicinal and pharmaceutical products | 1,787 | 1.7 | 1,333 | 1.4 | 320 | 0.7 | 2,332 | 6.1 | 8 | 0.0 |
| 55. Perfume,cleaning etc.preparations | 1 | 0.0 | 3 | 0.0 | 13 | 0.0 | 3 | 0.0 | ||
| 57. Plastics in primary forms | 3,070 | 2.8 | 3,902 | 4.0 | 3,341 | 6.9 | 1,316 | 3.4 | 1,730 | 3.7 |
| 58. Plastics in non-primary forms | 99 | 0.1 | 75 | 0.1 | 6 | 0.0 | 5 | 0.0 | 10 | 0.0 |
| 59. Chemical materials and products,n.e.s. | 123 | 0.1 | 147 | 0.2 | 234 | 0.5 | 302 | 0.8 | 381 | 0.8 |
| 6. Basic manufactures | 13,355 | 12.3 | 17,179 | 17.8 | 8,104 | 16.7 | 5,902 | 15.4 | 5,741 | 12.2 |
| 61. Leather,dressed fur,etc. | 17 | 0.0 | ||||||||
| 62. Rubber manufactures,n.e.s. | 30 | 0.0 | 66 | 0.1 | 15 | 0.0 | 34 | 0.1 | 41 | 0.1 |
| 63. Wood and cork manufactures | 24 | 0.0 | 6 | 0.0 | 3 | 0.0 | ||||
| 64. Paper,paperboard and articles thereof | 12,588 | 11.6 | 16,724 | 17.3 | 7,627 | 15.8 | 5,657 | 14.7 | 5,524 | 11.8 |
| 65. Textile yarn,fabrics,made up articles,etc. | 143 | 0.1 | 104 | 0.1 | 42 | 0.1 | 56 | 0.1 | 111 | 0.2 |
| 66. Non-metallic mineral manufactures,n.e.s. | 30 | 0.0 | 4 | 0.0 | 7 | 0.0 | 10 | 0.0 | ||
| 67. Iron and steel | 70 | 0.1 | 9 | 0.0 | 11 | 0.0 | 1 | 0.0 | ||
| 68. Non-ferrous metals | 38 | 0.0 | 11 | 0.0 | 137 | 0.3 | ||||
| 69. Manufactures of metals,n.e.s. | 485 | 0.4 | 210 | 0.2 | 245 | 0.5 | 148 | 0.4 | 52 | 0.1 |
| 7. Machinery,transport equipment | 53,009 | 49.0 | 25,164 | 26.0 | 7,267 | 15.0 | 6,166 | 16.1 | 12,245 | 26.1 |
| 71. Power generating machinery and equipment | 42,079 | 38.9 | 18,641 | 19.3 | 1,896 | 3.9 | 1,381 | 3.6 | 4,113 | 8.8 |
| 72. Machinery for specialized industries | 3,142 | 2.9 | 580 | 0.6 | 338 | 0.7 | 647 | 1.7 | 1,330 | 2.8 |
| 73. Metal working machinery | 185 | 0.2 | 109 | 0.1 | 60 | 0.1 | 76 | 0.2 | 80 | 0.2 |
| 74. General industrial machinery n.e.s. | 3,024 | 2.8 | 2,022 | 2.1 | 999 | 2.1 | 1,281 | 3.3 | 2,950 | 6.3 |
| 75. Office machines and adp machines | 246 | 0.2 | 73 | 0.1 | 10 | 0.0 | 8 | 0.0 | 1 | 0.0 |
| 76. Telecommunications and sound recording equipment | 1,062 | 1.0 | 848 | 0.9 | 1,751 | 3.6 | 462 | 1.2 | 223 | 0.5 |
| 77. Electric machinery,n.e.s.and parts | 3,270 | 3.0 | 2,891 | 3.0 | 2,213 | 4.6 | 2,306 | 6.0 | 3,506 | 7.5 |
| 78. Road vehicles | 1 | 0.0 | 5 | 0.0 | 42 | 0.1 | ||||
| 8. Miscellaneous manufactured articles | 1,143 | 1.1 | 1,133 | 1.2 | 1,179 | 2.4 | 1,405 | 3.7 | 999 | 2.1 |
| 81. Prefabr.buildings;sanitary,lighting etc.fixtrs | 25 | 0.0 | 9 | 0.0 | 105 | 0.2 | ||||
| 82. Furniture and parts thereof | 10 | 0.0 | 70 | 0.1 | ||||||
| 83. Travel goods,handbags and sim.containers | 6 | 0.0 | ||||||||
| 84. Articles of apparel and clothing accessories | 1 | 0.0 | 10 | 0.0 | 53 | 0.1 | 8 | 0.0 | 12 | 0.0 |
| 87. Instruments and apparates n.e.s. | 1,072 | 1.0 | 999 | 1.0 | 998 | 2.1 | 1,369 | 3.6 | 970 | 2.1 |
| 88. Photographic equipment,optical goods etc. | 1 | 0.0 | 1 | 0.0 | 3 | 0.0 | ||||
| 89. Miscellaneous manufactured articles,n.e.s. | 33 | 0.0 | 45 | 0.0 | 22 | 0.0 | 27 | 0.1 | 8 | 0.0 |
| All groups combined | 108,195 | 100.0 | 96,622 | 100.0 | 48,409 | 100.0 | 38,387 | 100.0 | 46,883 | 100.0 |
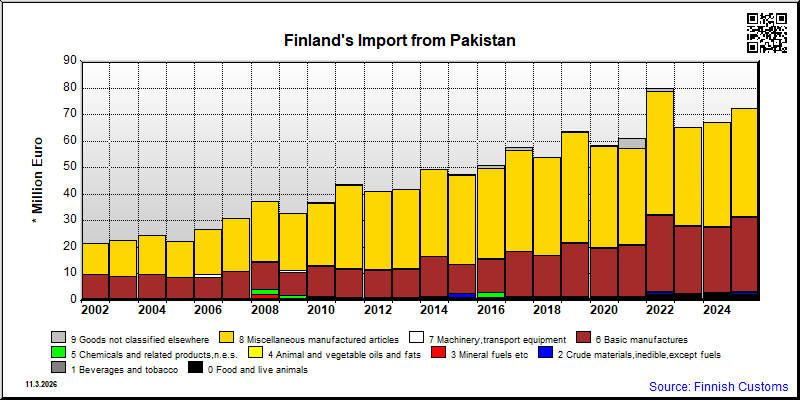
| 2021 | 2022 | 2023 | 2024 | 2025 | ||||||
|---|---|---|---|---|---|---|---|---|---|---|
| 1,000 € | % | 1,000 € | % | 1,000 € | % | 1,000 € | % | 1,000 € | % | |
| 0. Food and live animals | 963 | 1.6 | 2,113 | 2.6 | 2,081 | 3.2 | 2,380 | 3.5 | 2,303 | 3.2 |
| 01. Meat and meat preparations | 3 | 0.0 | ||||||||
| 02. Dairy products and birds' eggs | 2 | 0.0 | 6 | 0.0 | ||||||
| 03. Fish and fish preparations | 2 | 0.0 | 5 | 0.0 | ||||||
| 04. Cereals and cereal preparations | 401 | 0.7 | 520 | 0.7 | 1,108 | 1.7 | 1,366 | 2.0 | 1,157 | 1.6 |
| 05. Vegetables and fruit | 477 | 0.8 | 576 | 0.7 | 734 | 1.1 | 691 | 1.0 | 897 | 1.2 |
| 06. Sugars,sugar preparations and honey | 63 | 0.1 | 978 | 1.2 | 73 | 0.1 | 160 | 0.2 | 80 | 0.1 |
| 07. Coffee,tea,cocoa,spices | 7 | 0.0 | 23 | 0.0 | 136 | 0.2 | 123 | 0.2 | 107 | 0.1 |
| 09. Miscellaneous edible products and preparations | 14 | 0.0 | 15 | 0.0 | 23 | 0.0 | 37 | 0.1 | 56 | 0.1 |
| 1. Beverages and tobacco | 3 | 0.0 | 3 | 0.0 | 2 | 0.0 | 3 | 0.0 | ||
| 11. Beverages | 3 | 0.0 | 3 | 0.0 | 2 | 0.0 | 3 | 0.0 | ||
| 2. Crude materials,inedible,except fuels | 417 | 0.7 | 774 | 1.0 | 470 | 0.7 | 364 | 0.5 | 706 | 1.0 |
| 22. Oil seeds,oleaginous fruits | 115 | 0.2 | 135 | 0.2 | 253 | 0.4 | 56 | 0.1 | 21 | 0.0 |
| 26. Textile fibres and their wastes | 9 | 0.0 | 3 | 0.0 | 12 | 0.0 | 9 | 0.0 | ||
| 27. Crude fertilizers and crude minerals | 255 | 0.4 | 262 | 0.3 | 129 | 0.2 | 165 | 0.2 | 453 | 0.6 |
| 29. Crude animal,vegetable materials n.e.s. | 46 | 0.1 | 368 | 0.5 | 85 | 0.1 | 131 | 0.2 | 223 | 0.3 |
| 4. Animal and vegetable oils and fats | 19 | 0.0 | 3 | 0.0 | 1 | 0.0 | ||||
| 42. Fixed vegetable fats and oils | 19 | 0.0 | 3 | 0.0 | 1 | 0.0 | ||||
| 5. Chemicals and related products,n.e.s. | 259 | 0.4 | 300 | 0.4 | 262 | 0.4 | 339 | 0.5 | 325 | 0.4 |
| 52. Inorganic chemicals | 1 | 0.0 | 3 | 0.0 | 1 | 0.0 | ||||
| 53. Dyeing,tanning and colouring material | 2 | 0.0 | ||||||||
| 54. Medicinal and pharmaceutical products | 217 | 0.4 | 268 | 0.3 | 174 | 0.3 | 281 | 0.4 | 258 | 0.4 |
| 55. Perfume,cleaning etc.preparations | 6 | 0.0 | 9 | 0.0 | 11 | 0.0 | 8 | 0.0 | 52 | 0.1 |
| 57. Plastics in primary forms | 31 | 0.1 | 11 | 0.0 | 14 | 0.0 | ||||
| 58. Plastics in non-primary forms | 3 | 0.0 | 22 | 0.0 | 71 | 0.1 | 36 | 0.1 | ||
| 59. Chemical materials and products,n.e.s. | 6 | 0.0 | ||||||||
| 6. Basic manufactures | 19,195 | 31.5 | 28,961 | 36.2 | 25,104 | 38.5 | 24,402 | 36.4 | 28,081 | 38.7 |
| 61. Leather,dressed fur,etc. | 39 | 0.1 | 78 | 0.1 | 47 | 0.1 | 70 | 0.1 | 54 | 0.1 |
| 62. Rubber manufactures,n.e.s. | 10 | 0.0 | 13 | 0.0 | 5 | 0.0 | 5 | 0.0 | 5 | 0.0 |
| 64. Paper,paperboard and articles thereof | 34 | 0.1 | 39 | 0.0 | 19 | 0.0 | 11 | 0.0 | 20 | 0.0 |
| 65. Textile yarn,fabrics,made up articles,etc. | 18,872 | 31.0 | 28,446 | 35.6 | 24,786 | 38.0 | 24,002 | 35.8 | 27,777 | 38.3 |
| 66. Non-metallic mineral manufactures,n.e.s. | 17 | 0.0 | 8 | 0.0 | 16 | 0.0 | 50 | 0.1 | 39 | 0.1 |
| 67. Iron and steel | 2 | 0.0 | ||||||||
| 68. Non-ferrous metals | 82 | 0.1 | 2 | 0.0 | ||||||
| 69. Manufactures of metals,n.e.s. | 221 | 0.4 | 295 | 0.4 | 229 | 0.4 | 266 | 0.4 | 185 | 0.3 |
| 7. Machinery,transport equipment | 413 | 0.7 | 39 | 0.0 | 417 | 0.6 | 262 | 0.4 | 51 | 0.1 |
| 71. Power generating machinery and equipment | 229 | 0.4 | 2 | 0.0 | 2 | 0.0 | 5 | 0.0 | 1 | 0.0 |
| 72. Machinery for specialized industries | 1 | 0.0 | 2 | 0.0 | 1 | 0.0 | ||||
| 73. Metal working machinery | 8 | 0.0 | ||||||||
| 74. General industrial machinery n.e.s. | 3 | 0.0 | 6 | 0.0 | 391 | 0.6 | 205 | 0.3 | 25 | 0.0 |
| 76. Telecommunications and sound recording equipment | 144 | 0.2 | 2 | 0.0 | 1 | 0.0 | ||||
| 77. Electric machinery,n.e.s.and parts | 20 | 0.0 | 10 | 0.0 | 3 | 0.0 | 25 | 0.0 | 4 | 0.0 |
| 78. Road vehicles | 15 | 0.0 | 19 | 0.0 | 18 | 0.0 | 24 | 0.0 | 13 | 0.0 |
| 8. Miscellaneous manufactured articles | 35,939 | 59.0 | 46,378 | 58.0 | 36,723 | 56.3 | 39,197 | 58.4 | 40,860 | 56.4 |
| 81. Prefabr.buildings;sanitary,lighting etc.fixtrs | 170 | 0.3 | 87 | 0.1 | 34 | 0.1 | 60 | 0.1 | 33 | 0.0 |
| 82. Furniture and parts thereof | 642 | 1.1 | 517 | 0.6 | 521 | 0.8 | 379 | 0.6 | 193 | 0.3 |
| 83. Travel goods,handbags and sim.containers | 416 | 0.7 | 316 | 0.4 | 360 | 0.6 | 370 | 0.6 | 300 | 0.4 |
| 84. Articles of apparel and clothing accessories | 31,729 | 52.1 | 41,567 | 52.0 | 32,346 | 49.6 | 33,847 | 50.4 | 36,655 | 50.6 |
| 85. Footwear | 562 | 0.9 | 912 | 1.1 | 716 | 1.1 | 1,351 | 2.0 | 692 | 1.0 |
| 87. Instruments and apparates n.e.s. | 456 | 0.7 | 482 | 0.6 | 361 | 0.6 | 588 | 0.9 | 631 | 0.9 |
| 88. Photographic equipment,optical goods etc. | 1 | 0.0 | 5 | 0.0 | 7 | 0.0 | 3 | 0.0 | ||
| 89. Miscellaneous manufactured articles,n.e.s. | 1,964 | 3.2 | 2,492 | 3.1 | 2,385 | 3.7 | 2,594 | 3.9 | 2,353 | 3.2 |
| 9. Goods not classified elsewhere | 3,704 | 6.1 | 1,376 | 1.7 | 144 | 0.2 | 153 | 0.2 | 148 | 0.2 |
| 93. Special transactions and commodities not classified | 3,704 | 6.1 | 1,376 | 1.7 | 144 | 0.2 | 153 | 0.2 | 148 | 0.2 |
| All groups combined | 60,893 | 100.0 | 79,960 | 100.0 | 65,204 | 100.0 | 67,101 | 100.0 | 72,478 | 100.0 |
| Classification | Description | Year level | Quarter level | Month level | |
|---|---|---|---|---|---|
| SITC | Standard International Trade Classification (classification system is maintained by the United Nations) | ███ | ███ | ███ | |
| BEC | The standard of statistical classification of BEC (Broad Economic Categories) is upheld by the UN and it is based on SITC-nomenclature. | ███ | ███ | ███ | |
| NACE | National industrial classification based on Statistical Classification of Economic Activities in the European Community Nomenclature générale des Activités économiques dans les Communautés européennes | ███ | ███ | ███ | |
| CPA | CPA = Classification of Products by Activities | ███ | ███ | ███ | |
| CN | The Combined Nomenclature is the common nomenclature of the European Community. | ███ | ███ | ███ |