
| Export of goods from Finland and import to Finland | BEC (Broad Economic Categories) |
*) The standard of statistical classification of BEC (Broad Economic Categories) is upheld by the UN and it is based on SITC-nomenclature.
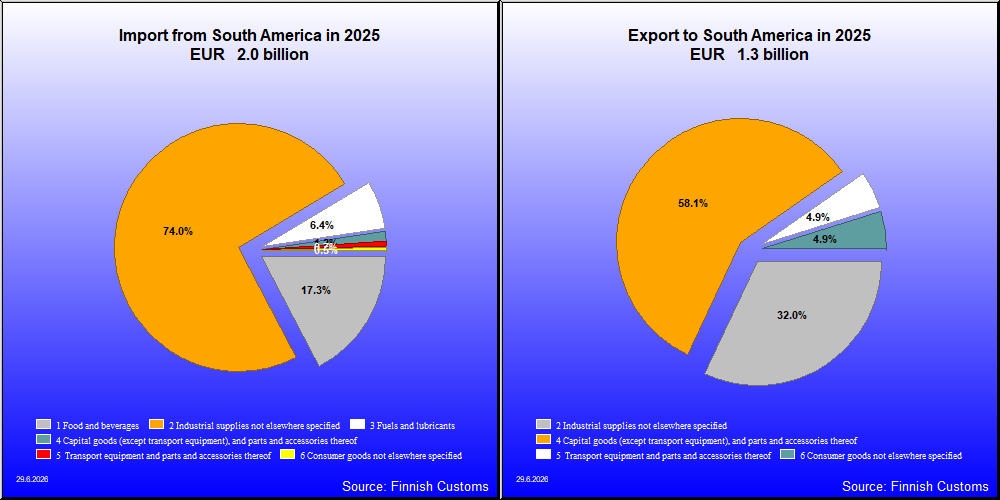
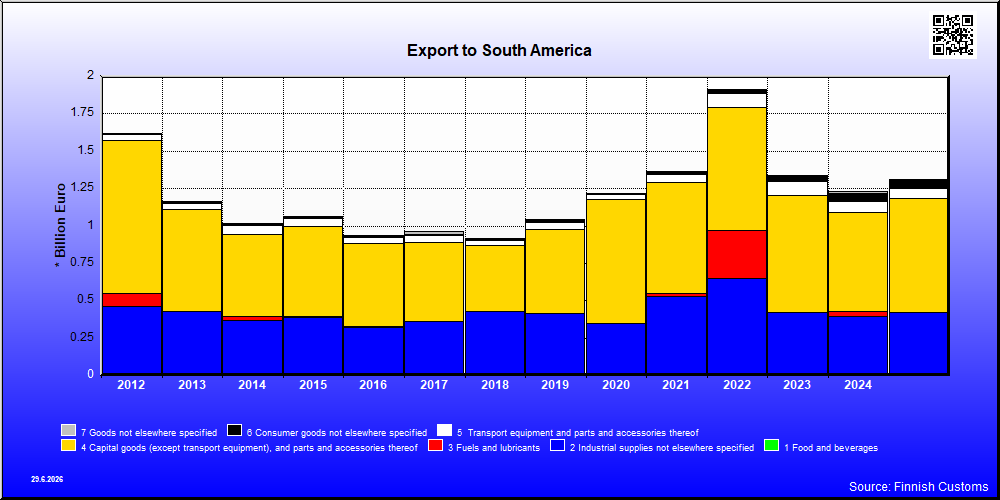
| 2021 | 2022 | 2023 | 2024 | 2025 | ||||||
|---|---|---|---|---|---|---|---|---|---|---|
| 1,000 € | % | 1,000 € | % | 1,000 € | % | 1,000 € | % | 1,000 € | % | |
| 1. Food and beverages | 2,013 | 0.1 | 1,181 | 0.1 | 2,499 | 0.2 | 799 | 0.1 | 530 | 0.0 |
| 11. Food and beverages, primary | 272 | 0.0 | 1 | 0.0 | 2 | 0.0 | 1 | 0.0 | ||
| 111. Food and beverages, primary, mainly for industry | 1 | 0.0 | ||||||||
| 112. Food and beverages, primary, mainly for household consumption | 272 | 0.0 | 2 | 0.0 | ||||||
| 12. Food and beverages, processed | 2,013 | 0.1 | 909 | 0.0 | 2,498 | 0.2 | 797 | 0.1 | 530 | 0.0 |
| 121. Food and beverages, processed, mainly for industry | 1,681 | 0.1 | 517 | 0.0 | 2,342 | 0.2 | 444 | 0.0 | 386 | 0.0 |
| 122. Food and beverages, processed, mainly for household consumption | 332 | 0.0 | 393 | 0.0 | 156 | 0.0 | 353 | 0.0 | 144 | 0.0 |
| 2. Industrial supplies not elsewhere specified | 528,801 | 38.7 | 649,511 | 34.0 | 419,622 | 31.3 | 394,209 | 32.0 | 420,105 | 32.0 |
| 21. Industrial supplies not elsewhere specified, primary | 562 | 0.0 | 408 | 0.0 | 1,178 | 0.1 | 444 | 0.0 | 456 | 0.0 |
| 22. Industrial supplies not elsewhere specified, processed | 528,239 | 38.7 | 649,103 | 33.9 | 418,443 | 31.2 | 393,765 | 31.9 | 419,649 | 32.0 |
| 3. Fuels and lubricants | 19,406 | 1.4 | 318,958 | 16.7 | 966 | 0.1 | 32,511 | 2.6 | 981 | 0.1 |
| 31. Fuels and lubricants, primary | 586 | 0.0 | 1,849 | 0.1 | 894 | 0.1 | 1,900 | 0.2 | 893 | 0.1 |
| 32. Fuels and lubricants, processed | 18,820 | 1.4 | 317,110 | 16.6 | 72 | 0.0 | 30,611 | 2.5 | 88 | 0.0 |
| 321. Fuels and lubricants, motor spirit | 18,799 | 1.4 | 316,752 | 16.6 | 30,521 | 2.5 | ||||
| 322. Fuels and lubricants, other | 21 | 0.0 | 357 | 0.0 | 72 | 0.0 | 3,437 | 0.3 | 88 | 0.0 |
| 4. Capital goods (except transport equipment), and parts and accessories thereof | 737,917 | 54.1 | 820,436 | 42.9 | 779,840 | 58.2 | 662,991 | 53.8 | 762,251 | 58.1 |
| 41. Capital goods (except transport equipment) | 318,391 | 23.3 | 465,459 | 24.3 | 400,582 | 29.9 | 406,602 | 33.0 | 474,596 | 36.2 |
| 42. Capital goods (except transport equipment), parts and accessories | 419,526 | 30.7 | 354,977 | 18.6 | 379,257 | 28.3 | 256,542 | 20.8 | 287,655 | 21.9 |
| 5. Transport equipment and parts and accessories thereof | 58,849 | 4.3 | 93,206 | 4.9 | 92,777 | 6.9 | 73,156 | 5.9 | 64,294 | 4.9 |
| 51. Passenger motor vehicles | 1 | 0.0 | 9 | 0.0 | 360 | 0.0 | 304 | 0.0 | 972 | 0.1 |
| 52. Transport equipment, other than passenger motor vehicles | 38,949 | 2.9 | 69,043 | 3.6 | 67,664 | 5.1 | 46,345 | 3.8 | 37,301 | 2.8 |
| 521. Transport equipment, other than passenger motor vehicles, industrial | 38,859 | 2.8 | 68,481 | 3.6 | 67,617 | 5.0 | 46,199 | 3.7 | 33,936 | 2.6 |
| 522. Transport equipment, other than passenger motor vehicles, non-industrial | 92 | 0.0 | 563 | 0.0 | 47 | 0.0 | 146 | 0.0 | 3,364 | 0.3 |
| 53. Transport equipment, parts and accessories | 19,900 | 1.5 | 24,154 | 1.3 | 24,753 | 1.8 | 26,507 | 2.2 | 26,021 | 2.0 |
| 6. Consumer goods not elsewhere specified | 16,868 | 1.2 | 27,954 | 1.5 | 32,435 | 2.4 | 57,030 | 4.6 | 64,441 | 4.9 |
| 61. Consumer goods not elsewhere specified, durable | 588 | 0.0 | 1,066 | 0.1 | 1,257 | 0.1 | 1,113 | 0.1 | 1,646 | 0.1 |
| 62. Consumer goods not elsewhere specified, semi-durable | 5,064 | 0.4 | 6,261 | 0.3 | 3,895 | 0.3 | 4,667 | 0.4 | 4,311 | 0.3 |
| 63. Consumer goods not elsewhere specified, non-durable | 11,216 | 0.8 | 20,628 | 1.1 | 27,283 | 2.0 | 51,251 | 4.2 | 58,485 | 4.5 |
| 7. Goods not elsewhere specified | 821 | 0.1 | 977 | 0.1 | 11,650 | 0.9 | 12,096 | 1.0 | 116 | 0.0 |
| All groups | 1,364,675 | 100.0 | 1,912,225 | 100.0 | 1,339,788 | 100.0 | 1,232,792 | 100.0 | 1,312,718 | 100.0 |
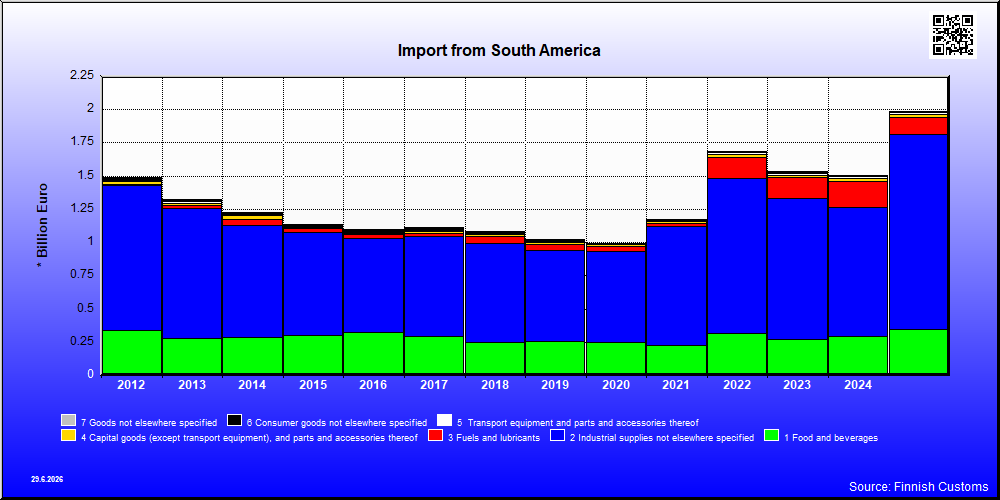
| 2021 | 2022 | 2023 | 2024 | 2025 | ||||||
|---|---|---|---|---|---|---|---|---|---|---|
| 1,000 € | % | 1,000 € | % | 1,000 € | % | 1,000 € | % | 1,000 € | % | |
| 1. Food and beverages | 227,517 | 19.3 | 317,732 | 18.8 | 269,223 | 17.6 | 294,278 | 19.5 | 343,938 | 17.3 |
| 11. Food and beverages, primary | 170,315 | 14.5 | 228,062 | 13.5 | 191,575 | 12.5 | 213,529 | 14.2 | 275,064 | 13.8 |
| 111. Food and beverages, primary, mainly for industry | 114,293 | 9.7 | 179,427 | 10.6 | 126,445 | 8.2 | 163,447 | 10.8 | 203,941 | 10.3 |
| 112. Food and beverages, primary, mainly for household consumption | 56,022 | 4.8 | 48,636 | 2.9 | 65,130 | 4.2 | 50,082 | 3.3 | 71,122 | 3.6 |
| 12. Food and beverages, processed | 57,202 | 4.9 | 89,669 | 5.3 | 77,648 | 5.1 | 80,749 | 5.4 | 68,874 | 3.5 |
| 121. Food and beverages, processed, mainly for industry | 4,534 | 0.4 | 28,863 | 1.7 | 20,413 | 1.3 | 10,671 | 0.7 | 2,595 | 0.1 |
| 122. Food and beverages, processed, mainly for household consumption | 52,668 | 4.5 | 60,807 | 3.6 | 57,236 | 3.7 | 70,078 | 4.6 | 66,280 | 3.3 |
| 2. Industrial supplies not elsewhere specified | 893,791 | 76.0 | 1,167,829 | 69.2 | 1,066,388 | 69.5 | 967,416 | 64.2 | 1,470,368 | 73.9 |
| 21. Industrial supplies not elsewhere specified, primary | 787,001 | 66.9 | 837,866 | 49.6 | 789,558 | 51.5 | 697,287 | 46.3 | 1,187,839 | 59.7 |
| 22. Industrial supplies not elsewhere specified, processed | 106,790 | 9.1 | 329,963 | 19.5 | 276,830 | 18.0 | 270,129 | 17.9 | 282,529 | 14.2 |
| 3. Fuels and lubricants | 22,581 | 1.9 | 155,991 | 9.2 | 151,951 | 9.9 | 198,401 | 13.2 | 126,885 | 6.4 |
| 31. Fuels and lubricants, primary | 91,931 | 5.4 | 95,928 | 6.3 | 145,122 | 9.6 | 88,473 | 4.4 | ||
| 32. Fuels and lubricants, processed | 22,581 | 1.9 | 64,060 | 3.8 | 56,023 | 3.7 | 53,279 | 3.5 | 38,412 | 1.9 |
| 321. Fuels and lubricants, motor spirit | 26 | 0.0 | ||||||||
| 322. Fuels and lubricants, other | 22,555 | 1.9 | 64,060 | 3.8 | 56,023 | 3.7 | 53,279 | 3.5 | 38,412 | 1.9 |
| 4. Capital goods (except transport equipment), and parts and accessories thereof | 12,943 | 1.1 | 22,048 | 1.3 | 19,795 | 1.3 | 24,015 | 1.6 | 23,374 | 1.2 |
| 41. Capital goods (except transport equipment) | 7,937 | 0.7 | 15,208 | 0.9 | 11,692 | 0.8 | 12,823 | 0.9 | 16,463 | 0.8 |
| 42. Capital goods (except transport equipment), parts and accessories | 5,006 | 0.4 | 6,841 | 0.4 | 8,103 | 0.5 | 11,192 | 0.7 | 6,911 | 0.3 |
| 5. Transport equipment and parts and accessories thereof | 12,603 | 1.1 | 15,062 | 0.9 | 15,828 | 1.0 | 11,983 | 0.8 | 14,147 | 0.7 |
| 51. Passenger motor vehicles | 38 | 0.0 | 96 | 0.0 | 6 | 0.0 | ||||
| 52. Transport equipment, other than passenger motor vehicles | 25 | 0.0 | 14 | 0.0 | 836 | 0.1 | 584 | 0.0 | 4,975 | 0.3 |
| 521. Transport equipment, other than passenger motor vehicles, industrial | 10 | 0.0 | 2 | 0.0 | 793 | 0.1 | 584 | 0.0 | 4,975 | 0.3 |
| 522. Transport equipment, other than passenger motor vehicles, non-industrial | 15 | 0.0 | 12 | 0.0 | 43 | 0.0 | ||||
| 53. Transport equipment, parts and accessories | 12,540 | 1.1 | 14,951 | 0.9 | 14,991 | 1.0 | 11,399 | 0.8 | 9,165 | 0.5 |
| 6. Consumer goods not elsewhere specified | 5,677 | 0.5 | 7,963 | 0.5 | 8,751 | 0.6 | 9,920 | 0.7 | 9,550 | 0.5 |
| 61. Consumer goods not elsewhere specified, durable | 388 | 0.0 | 300 | 0.0 | 153 | 0.0 | 234 | 0.0 | 224 | 0.0 |
| 62. Consumer goods not elsewhere specified, semi-durable | 2,223 | 0.2 | 2,766 | 0.2 | 3,388 | 0.2 | 2,218 | 0.1 | 1,855 | 0.1 |
| 63. Consumer goods not elsewhere specified, non-durable | 3,067 | 0.3 | 4,897 | 0.3 | 5,211 | 0.3 | 7,468 | 0.5 | 7,471 | 0.4 |
| 7. Goods not elsewhere specified | 819 | 0.1 | 1,790 | 0.1 | 1,881 | 0.1 | 1,197 | 0.1 | 856 | 0.0 |
| All groups | 1,175,926 | 100.0 | 1,688,412 | 100.0 | 1,533,818 | 100.0 | 1,507,210 | 100.0 | 1,989,118 | 100.0 |
| Classification | Description | Year level | Quarter level | Month level | |
|---|---|---|---|---|---|
| SITC | Standard International Trade Classification (classification system is maintained by the United Nations) | ███ | ███ | ███ | |
| BEC | The standard of statistical classification of BEC (Broad Economic Categories) is upheld by the UN and it is based on SITC-nomenclature. | ███ | ███ | ███ | |
| NACE | National industrial classification based on Statistical Classification of Economic Activities in the European Community Nomenclature générale des Activités économiques dans les Communautés européennes | ███ | ███ | ███ | |
| CPA | CPA = Classification of Products by Activities | ███ | ███ | ███ | |
| CN | The Combined Nomenclature is the common nomenclature of the European Community. | ███ | ███ | ███ |