
| Export of goods from Finland and import to Finland | Trade Balance |

| Import 1,000 € | Export 1,000 € | Trade 1,000 € | Trade Balance 1,000 € | |
|---|---|---|---|---|
| 2019 Q1 | 3,559,325 | 1,993,750 | 5,553,075 | -1,565,575 |
| 2019 Q2 | 3,579,248 | 2,418,201 | 5,997,449 | -1,161,046 |
| 2019 Q3 | 3,834,410 | 2,278,257 | 6,112,666 | -1,556,153 |
| 2019 Q4 | 3,729,619 | 2,307,324 | 6,036,944 | -1,422,295 |
| 2020 Q1 | 3,156,455 | 1,823,850 | 4,980,305 | -1,332,604 |
| 2020 Q2 | 2,660,229 | 1,886,662 | 4,546,891 | -773,567 |
| 2020 Q3 | 3,226,523 | 1,861,043 | 5,087,566 | -1,365,479 |
| 2020 Q4 | 3,040,545 | 2,085,574 | 5,126,118 | -954,971 |
| 2021 Q1 | 3,576,885 | 2,019,974 | 5,596,859 | -1,556,910 |
| 2021 Q2 | 3,233,796 | 2,462,985 | 5,696,781 | -770,811 |
| 2021 Q3 | 4,096,997 | 2,287,509 | 6,384,506 | -1,809,488 |
| 2021 Q4 | 5,494,009 | 2,390,899 | 7,884,908 | -3,103,110 |
| 2022 Q1 | 5,370,790 | 2,206,539 | 7,577,330 | -3,164,251 |
| 2022 Q2 | 4,003,636 | 2,009,954 | 6,013,590 | -1,993,683 |
| 2022 Q3 | 4,031,762 | 2,043,459 | 6,075,220 | -1,988,303 |
| 2022 Q4 | 3,375,339 | 2,233,942 | 5,609,281 | -1,141,397 |
| 2023 Q1 | 2,553,408 | 1,775,136 | 4,328,544 | -778,273 |
| 2023 Q2 | 2,156,987 | 1,622,763 | 3,779,750 | -534,224 |
| 2023 Q3 | 2,384,455 | 1,542,292 | 3,926,748 | -842,163 |
| 2023 Q4 | 2,545,357 | 1,567,533 | 4,112,890 | -977,825 |
| 2024 Q1 | 2,051,088 | 1,200,659 | 3,251,747 | -850,429 |
| 2024 Q2 | 2,591,989 | 1,691,689 | 4,283,679 | -900,300 |
| 2024 Q3 | 2,642,390 | 1,534,056 | 4,176,446 | -1,108,334 |
| 2024 Q4 | 2,439,225 | 1,600,230 | 4,039,455 | -838,995 |
| 2025 Q1 | 2,208,177 | 1,625,108 | 3,833,285 | -583,069 |
| 2025 Q2 | 2,214,153 | 1,350,421 | 3,564,574 | -863,732 |
| 2025 Q3 | 2,409,838 | 1,409,710 | 3,819,548 | -1,000,128 |
| 2025 Q4 | 2,451,874 | 1,638,650 | 4,090,524 | -813,224 |
| 2026 Q1 | 2,815,593 | 1,449,220 | 4,264,813 | -1,366,373 |
| 2026 Q2 | 2,812,033 | 1,599,396 | 4,411,430 | -1,212,637 |

| Q2 / 2026 | Q2 / 2025 | Muutos edellisestä vastaavasta kaudesta % | ||
|---|---|---|---|---|
| 1,000 € | % | 1,000 € | ||
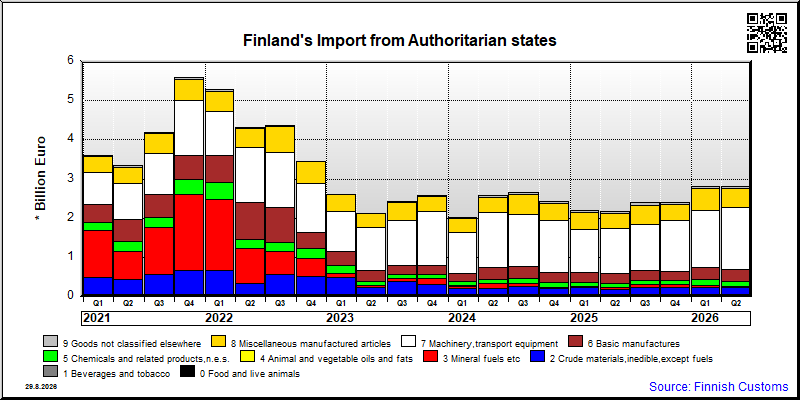
| 0. Food and live animals | 37,363 | 2.3 | 32,465 | 15.1 |
| 1. Beverages and tobacco | 530 | 0.0 | 612 | -13.4 |
| 2. Crude materials,inedible,except fuels | 614,323 | 38.4 | 497,124 | 23.6 |
| 3. Mineral fuels etc | 234 | 0.0 | 278 | -15.6 |
| 4. Animal and vegetable oils and fats | 215 | 0.0 | 252 | -14.5 |
| 5. Chemicals and related products,n.e.s. | 116,914 | 7.3 | 100,418 | 16.4 |
| 6. Basic manufactures | 137,030 | 8.6 | 120,336 | 13.9 |
| 7. Machinery,transport equipment | 596,709 | 37.3 | 480,509 | 24.2 |
| 8. Miscellaneous manufactured articles | 96,066 | 6.0 | 117,567 | -18.3 |
| 9. Goods not classified elsewhere | 13 | 0.0 | 0 | .. |
| All groups combined | 1,599,396 | 100.0 | 1,349,530 | 18.5 |
| Q2 / 2026 | Q2 / 2025 | Muutos edellisestä vastaavasta kaudesta % | ||
|---|---|---|---|---|
| 1,000 € | % | 1,000 € | ||
| 0. Food and live animals | 45,516 | 1.6 | 38,703 | 17.6 |
| 1. Beverages and tobacco | 1,063 | 0.0 | 484 | 119.5 |
| 2. Crude materials,inedible,except fuels | 182,064 | 6.5 | 137,148 | 32.7 |
| 3. Mineral fuels etc | 16,518 | 0.6 | 44,890 | -63.2 |
| 4. Animal and vegetable oils and fats | 357 | 0.0 | 56 | 534.0 |
| 5. Chemicals and related products,n.e.s. | 130,149 | 4.6 | 114,679 | 13.5 |
| 6. Basic manufactures | 311,091 | 11.1 | 253,810 | 22.6 |
| 7. Machinery,transport equipment | 1,579,989 | 56.2 | 1,153,820 | 36.9 |
| 8. Miscellaneous manufactured articles | 498,429 | 17.7 | 370,383 | 34.6 |
| 9. Goods not classified elsewhere | 46,904 | 1.7 | 58,652 | -20.0 |
| All groups combined | 2,812,033 | 100.0 | 2,172,582 | 29.4 |
| Classification | Description | Year level | Quarter level | Month level | Year 2026 sofar |
|---|---|---|---|---|---|
| SITC | Standard International Trade Classification (classification system is maintained by the United Nations) | ███ | ███ | ███ | ███ |
| BEC | The standard of statistical classification of BEC (Broad Economic Categories) is upheld by the UN and it is based on SITC-nomenclature. | ███ | ███ | ███ | ███ |
| NACE | National industrial classification based on Statistical Classification of Economic Activities in the European Community Nomenclature générale des Activités économiques dans les Communautés européennes | ███ | ███ | ███ | ███ |
| CPA | CPA = Classification of Products by Activities | ███ | ███ | ███ | ███ |
| CN | The Combined Nomenclature is the common nomenclature of the European Community. | ███ | ███ | ███ | ███ |