
| Export of goods from Finland and import to Finland | BEC (Broad Economic Categories) |
*) The standard of statistical classification of BEC (Broad Economic Categories) is upheld by the UN and it is based on SITC-nomenclature.

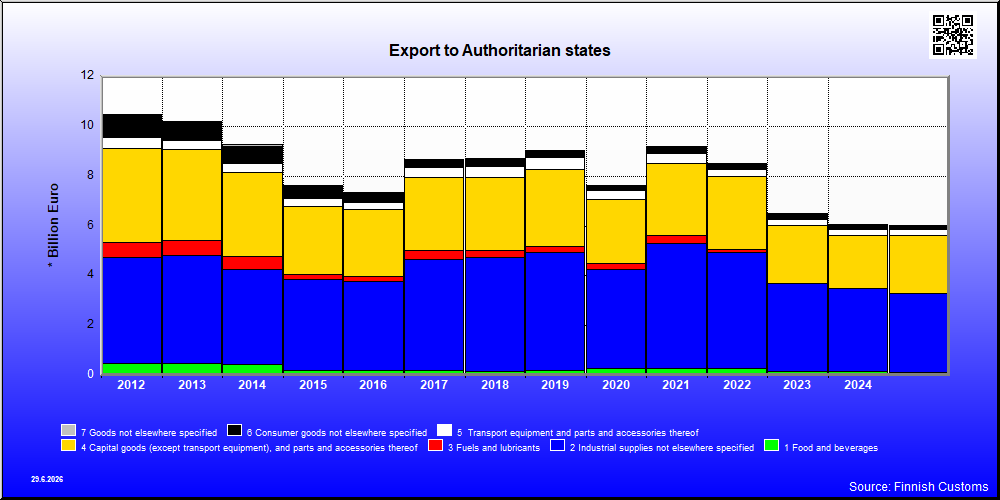
| 2021 | 2022 | 2023 | 2024 | 2025 | ||||||
|---|---|---|---|---|---|---|---|---|---|---|
| 1,000 € | % | 1,000 € | % | 1,000 € | % | 1,000 € | % | 1,000 € | % | |
| 1. Food and beverages | 270,408 | 2.9 | 274,297 | 3.2 | 166,037 | 2.6 | 147,317 | 2.4 | 134,363 | 2.2 |
| 11. Food and beverages, primary | 16,935 | 0.2 | 25,710 | 0.3 | 3,860 | 0.1 | 1,326 | 0.0 | 813 | 0.0 |
| 111. Food and beverages, primary, mainly for industry | 6,989 | 0.1 | 16,622 | 0.2 | 13 | 0.0 | 188 | 0.0 | 8 | 0.0 |
| 112. Food and beverages, primary, mainly for household consumption | 9,946 | 0.1 | 9,087 | 0.1 | 3,847 | 0.1 | 1,138 | 0.0 | 805 | 0.0 |
| 12. Food and beverages, processed | 253,472 | 2.8 | 248,587 | 2.9 | 162,176 | 2.5 | 145,991 | 2.4 | 133,550 | 2.2 |
| 121. Food and beverages, processed, mainly for industry | 115,015 | 1.3 | 146,374 | 1.7 | 77,371 | 1.2 | 75,242 | 1.2 | 56,532 | 0.9 |
| 122. Food and beverages, processed, mainly for household consumption | 138,457 | 1.5 | 102,214 | 1.2 | 84,805 | 1.3 | 70,749 | 1.2 | 77,018 | 1.3 |
| 2. Industrial supplies not elsewhere specified | 5,018,245 | 54.7 | 4,650,609 | 54.5 | 3,512,284 | 54.0 | 3,326,886 | 55.1 | 3,169,303 | 52.5 |
| 21. Industrial supplies not elsewhere specified, primary | 448,559 | 4.9 | 414,061 | 4.9 | 270,802 | 4.2 | 524,625 | 8.7 | 321,714 | 5.3 |
| 22. Industrial supplies not elsewhere specified, processed | 4,569,686 | 49.8 | 4,236,548 | 49.7 | 3,241,485 | 49.8 | 2,802,261 | 46.4 | 2,847,588 | 47.2 |
| 3. Fuels and lubricants | 340,047 | 3.7 | 134,957 | 1.6 | 17,871 | 0.3 | 1,994 | 0.0 | 1,759 | 0.0 |
| 31. Fuels and lubricants, primary | 929 | 0.0 | 950 | 0.0 | 536 | 0.0 | 1,336 | 0.0 | 1,113 | 0.0 |
| 32. Fuels and lubricants, processed | 339,117 | 3.7 | 134,007 | 1.6 | 17,335 | 0.3 | 658 | 0.0 | 646 | 0.0 |
| 321. Fuels and lubricants, motor spirit | 289,991 | 3.2 | 757 | 0.0 | 23 | 0.0 | 65 | 0.0 | 220 | 0.0 |
| 322. Fuels and lubricants, other | 49,127 | 0.5 | 133,250 | 1.6 | 17,312 | 0.3 | 594 | 0.0 | 426 | 0.0 |
| 4. Capital goods (except transport equipment), and parts and accessories thereof | 2,864,686 | 31.2 | 2,923,835 | 34.3 | 2,310,532 | 35.5 | 2,126,405 | 35.2 | 2,296,851 | 38.1 |
| 41. Capital goods (except transport equipment) | 2,019,135 | 22.0 | 2,180,380 | 25.6 | 1,562,786 | 24.0 | 1,424,192 | 23.6 | 1,455,479 | 24.1 |
| 42. Capital goods (except transport equipment), parts and accessories | 845,551 | 9.2 | 743,455 | 8.7 | 747,746 | 11.5 | 702,638 | 11.6 | 841,380 | 13.9 |
| 5. Transport equipment and parts and accessories thereof | 419,549 | 4.6 | 285,104 | 3.3 | 272,186 | 4.2 | 240,395 | 4.0 | 269,993 | 4.5 |
| 51. Passenger motor vehicles | 31,586 | 0.3 | 13,312 | 0.2 | 11,405 | 0.2 | 7,113 | 0.1 | 2,484 | 0.0 |
| 52. Transport equipment, other than passenger motor vehicles | 247,059 | 2.7 | 184,392 | 2.2 | 170,859 | 2.6 | 90,862 | 1.5 | 116,931 | 1.9 |
| 521. Transport equipment, other than passenger motor vehicles, industrial | 162,052 | 1.8 | 152,913 | 1.8 | 155,427 | 2.4 | 73,399 | 1.2 | 99,724 | 1.7 |
| 522. Transport equipment, other than passenger motor vehicles, non-industrial | 85,007 | 0.9 | 31,479 | 0.4 | 15,433 | 0.2 | 17,463 | 0.3 | 17,207 | 0.3 |
| 53. Transport equipment, parts and accessories | 140,904 | 1.5 | 87,437 | 1.0 | 89,922 | 1.4 | 142,426 | 2.4 | 150,633 | 2.5 |
| 6. Consumer goods not elsewhere specified | 256,591 | 2.8 | 254,339 | 3.0 | 226,639 | 3.5 | 196,854 | 3.3 | 161,126 | 2.7 |
| 61. Consumer goods not elsewhere specified, durable | 30,504 | 0.3 | 35,290 | 0.4 | 30,390 | 0.5 | 19,928 | 0.3 | 23,004 | 0.4 |
| 62. Consumer goods not elsewhere specified, semi-durable | 76,546 | 0.8 | 76,755 | 0.9 | 62,253 | 1.0 | 53,177 | 0.9 | 50,373 | 0.8 |
| 63. Consumer goods not elsewhere specified, non-durable | 149,588 | 1.6 | 142,294 | 1.7 | 133,996 | 2.1 | 123,750 | 2.0 | 87,750 | 1.5 |
| 7. Goods not elsewhere specified | 4,657 | 0.1 | 4,135 | 0.0 | 1,671 | 0.0 | 980 | 0.0 | 2,047 | 0.0 |
| All groups | 9,174,174 | 100.0 | 8,527,276 | 100.0 | 6,507,220 | 100.0 | 6,040,766 | 100.0 | 6,035,376 | 100.0 |

| 2021 | 2022 | 2023 | 2024 | 2025 | ||||||
|---|---|---|---|---|---|---|---|---|---|---|
| 1,000 € | % | 1,000 € | % | 1,000 € | % | 1,000 € | % | 1,000 € | % | |
| 1. Food and beverages | 79,285 | 0.5 | 102,772 | 0.6 | 87,946 | 0.9 | 113,515 | 1.2 | 137,614 | 1.5 |
| 11. Food and beverages, primary | 44,084 | 0.3 | 55,306 | 0.3 | 49,020 | 0.5 | 65,562 | 0.7 | 84,768 | 0.9 |
| 111. Food and beverages, primary, mainly for industry | 13,370 | 0.1 | 25,507 | 0.1 | 17,857 | 0.2 | 20,041 | 0.2 | 22,195 | 0.2 |
| 112. Food and beverages, primary, mainly for household consumption | 30,715 | 0.2 | 29,799 | 0.2 | 31,164 | 0.3 | 45,522 | 0.5 | 62,573 | 0.7 |
| 12. Food and beverages, processed | 35,201 | 0.2 | 47,467 | 0.3 | 38,926 | 0.4 | 47,954 | 0.5 | 52,846 | 0.6 |
| 121. Food and beverages, processed, mainly for industry | 2,544 | 0.0 | 9,821 | 0.1 | 528 | 0.0 | 2,111 | 0.0 | 944 | 0.0 |
| 122. Food and beverages, processed, mainly for household consumption | 32,656 | 0.2 | 37,646 | 0.2 | 38,398 | 0.4 | 45,843 | 0.5 | 51,902 | 0.6 |
| 2. Industrial supplies not elsewhere specified | 5,473,210 | 32.7 | 6,087,420 | 35.0 | 2,820,437 | 29.3 | 2,249,047 | 23.3 | 2,088,423 | 22.8 |
| 21. Industrial supplies not elsewhere specified, primary | 664,001 | 4.0 | 148,361 | 0.9 | 40,801 | 0.4 | 35,588 | 0.4 | 47,097 | 0.5 |
| 22. Industrial supplies not elsewhere specified, processed | 4,809,209 | 28.8 | 5,939,059 | 34.1 | 2,779,636 | 28.9 | 2,213,459 | 22.9 | 2,041,328 | 22.3 |
| 3. Fuels and lubricants | 5,032,210 | 30.1 | 3,710,399 | 21.3 | 404,260 | 4.2 | 327,596 | 3.4 | 199,926 | 2.2 |
| 31. Fuels and lubricants, primary | 3,712,602 | 22.2 | 1,711,059 | 9.8 | 5,171 | 0.1 | 16,299 | 0.2 | ||
| 32. Fuels and lubricants, processed | 1,319,608 | 7.9 | 1,999,340 | 11.5 | 403,198 | 4.2 | 311,297 | 3.2 | 199,926 | 2.2 |
| 321. Fuels and lubricants, motor spirit | 646,304 | 3.9 | 267,333 | 1.5 | ||||||
| 322. Fuels and lubricants, other | 673,304 | 4.0 | 1,732,008 | 10.0 | 403,198 | 4.2 | 311,297 | 3.2 | 199,926 | 2.2 |
| 4. Capital goods (except transport equipment), and parts and accessories thereof | 3,416,241 | 20.4 | 4,248,228 | 24.4 | 3,354,396 | 34.9 | 3,545,370 | 36.7 | 3,469,132 | 37.8 |
| 41. Capital goods (except transport equipment) | 2,487,844 | 14.9 | 3,108,583 | 17.9 | 2,555,731 | 26.6 | 2,626,347 | 27.2 | 2,646,621 | 28.9 |
| 42. Capital goods (except transport equipment), parts and accessories | 928,397 | 5.6 | 1,139,645 | 6.5 | 798,665 | 8.3 | 919,024 | 9.5 | 822,555 | 9.0 |
| 5. Transport equipment and parts and accessories thereof | 735,705 | 4.4 | 985,334 | 5.7 | 1,273,090 | 13.2 | 1,515,185 | 15.7 | 1,191,096 | 13.0 |
| 51. Passenger motor vehicles | 14,196 | 0.1 | 22,062 | 0.1 | 162,843 | 1.7 | 246,011 | 2.5 | 209,722 | 2.3 |
| 52. Transport equipment, other than passenger motor vehicles | 352,333 | 2.1 | 321,833 | 1.8 | 450,764 | 4.7 | 150,681 | 1.6 | 111,764 | 1.2 |
| 521. Transport equipment, other than passenger motor vehicles, industrial | 305,149 | 1.8 | 265,013 | 1.5 | 412,603 | 4.3 | 119,568 | 1.2 | 73,787 | 0.8 |
| 522. Transport equipment, other than passenger motor vehicles, non-industrial | 47,184 | 0.3 | 56,819 | 0.3 | 38,160 | 0.4 | 31,114 | 0.3 | 37,977 | 0.4 |
| 53. Transport equipment, parts and accessories | 369,176 | 2.2 | 641,439 | 3.7 | 659,484 | 6.9 | 1,118,493 | 11.6 | 869,609 | 9.5 |
| 6. Consumer goods not elsewhere specified | 1,828,221 | 10.9 | 2,174,334 | 12.5 | 1,635,400 | 17.0 | 1,736,883 | 18.0 | 1,847,387 | 20.2 |
| 61. Consumer goods not elsewhere specified, durable | 385,434 | 2.3 | 417,322 | 2.4 | 307,027 | 3.2 | 384,605 | 4.0 | 454,502 | 5.0 |
| 62. Consumer goods not elsewhere specified, semi-durable | 1,145,491 | 6.8 | 1,474,648 | 8.5 | 1,104,832 | 11.5 | 1,110,014 | 11.5 | 1,150,161 | 12.5 |
| 63. Consumer goods not elsewhere specified, non-durable | 297,332 | 1.8 | 282,364 | 1.6 | 223,541 | 2.3 | 242,264 | 2.5 | 242,724 | 2.6 |
| 7. Goods not elsewhere specified | 161,856 | 1.0 | 98,193 | 0.6 | 41,306 | 0.4 | 174,427 | 1.8 | 232,483 | 2.5 |
| All groups | 16,726,706 | 100.0 | 17,406,631 | 100.0 | 9,616,717 | 100.0 | 9,661,793 | 100.0 | 9,166,012 | 100.0 |
| Classification | Description | Year level | Quarter level | Month level | |
|---|---|---|---|---|---|
| SITC | Standard International Trade Classification (classification system is maintained by the United Nations) | ███ | ███ | ███ | |
| BEC | The standard of statistical classification of BEC (Broad Economic Categories) is upheld by the UN and it is based on SITC-nomenclature. | ███ | ███ | ███ | |
| NACE | National industrial classification based on Statistical Classification of Economic Activities in the European Community Nomenclature générale des Activités économiques dans les Communautés européennes | ███ | ███ | ███ | |
| CPA | CPA = Classification of Products by Activities | ███ | ███ | ███ | |
| CN | The Combined Nomenclature is the common nomenclature of the European Community. | ███ | ███ | ███ |