
| Export of goods from Finland and import to Finland | BEC (Broad Economic Categories) |
*) The standard of statistical classification of BEC (Broad Economic Categories) is upheld by the UN and it is based on SITC-nomenclature.

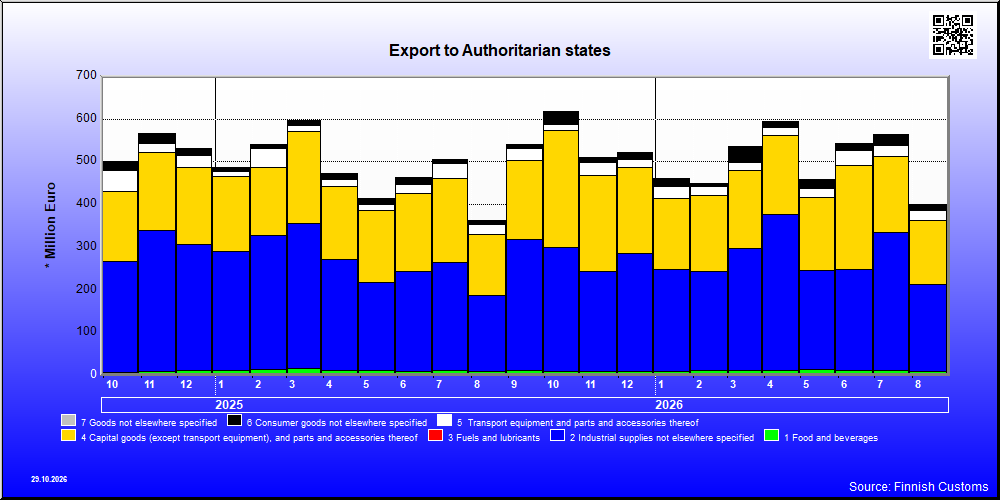
| 8 / 2026 | 8 / 2025 | Change from previous year's equal month % | ||
|---|---|---|---|---|
| 1,000 € | % | 1000 € | ||
| 1. Food and beverages | 9,908 | 2.5 | 9,263 | 7.0 |
| 11. Food and beverages, primary | 20 | 0.0 | 27 | -27.5 |
| 112. Food and beverages, primary, mainly for household consumption | 20 | 0.0 | 27 | -27.5 |
| 12. Food and beverages, processed | 9,888 | 2.5 | 9,236 | 7.1 |
| 121. Food and beverages, processed, mainly for industry | 5,661 | 1.4 | 3,373 | 67.8 |
| 122. Food and beverages, processed, mainly for household consumption | 4,227 | 1.1 | 5,863 | -27.9 |
| 2. Industrial supplies not elsewhere specified | 204,019 | 50.9 | 176,903 | 15.3 |
| 21. Industrial supplies not elsewhere specified, primary | 38,157 | 9.5 | 10,577 | 260.8 |
| 22. Industrial supplies not elsewhere specified, processed | 165,862 | 41.4 | 166,326 | -0.3 |
| 3. Fuels and lubricants | 46 | 0.0 | 159 | -71.0 |
| 31. Fuels and lubricants, primary | 26 | 0.0 | 155 | -83.4 |
| 32. Fuels and lubricants, processed | 20 | 0.0 | 4 | 458.7 |
| 322. Fuels and lubricants, other | 20 | 0.0 | 4 | 458.7 |
| 4. Capital goods (except transport equipment), and parts and accessories thereof | 149,176 | 37.2 | 143,061 | 4.3 |
| 41. Capital goods (except transport equipment) | 80,742 | 20.1 | 78,475 | 2.9 |
| 42. Capital goods (except transport equipment), parts and accessories | 68,435 | 17.1 | 64,586 | 6.0 |
| 5. Transport equipment and parts and accessories thereof | 22,919 | 5.7 | 22,999 | -0.3 |
| 51. Passenger motor vehicles | 85 | 0.0 | 76 | 12.6 |
| 52. Transport equipment, other than passenger motor vehicles | 8,644 | 2.2 | 5,204 | 66.1 |
| 521. Transport equipment, other than passenger motor vehicles, industrial | 7,466 | 1.9 | 3,576 | 108.8 |
| 522. Transport equipment, other than passenger motor vehicles, non-industrial | 1,178 | 0.3 | 1,628 | -27.7 |
| 53. Transport equipment, parts and accessories | 14,191 | 3.5 | 17,719 | -19.9 |
| 6. Consumer goods not elsewhere specified | 14,504 | 3.6 | 10,022 | 44.7 |
| 61. Consumer goods not elsewhere specified, durable | 1,339 | 0.3 | 2,351 | -43.1 |
| 62. Consumer goods not elsewhere specified, semi-durable | 4,432 | 1.1 | 3,259 | 36.0 |
| 63. Consumer goods not elsewhere specified, non-durable | 8,733 | 2.2 | 4,412 | 97.9 |
| 7. Goods not elsewhere specified | 299 | 0.1 | 6 | .. |
| All groups | 400,871 | 100.0 | 362,413 | 10.6 |
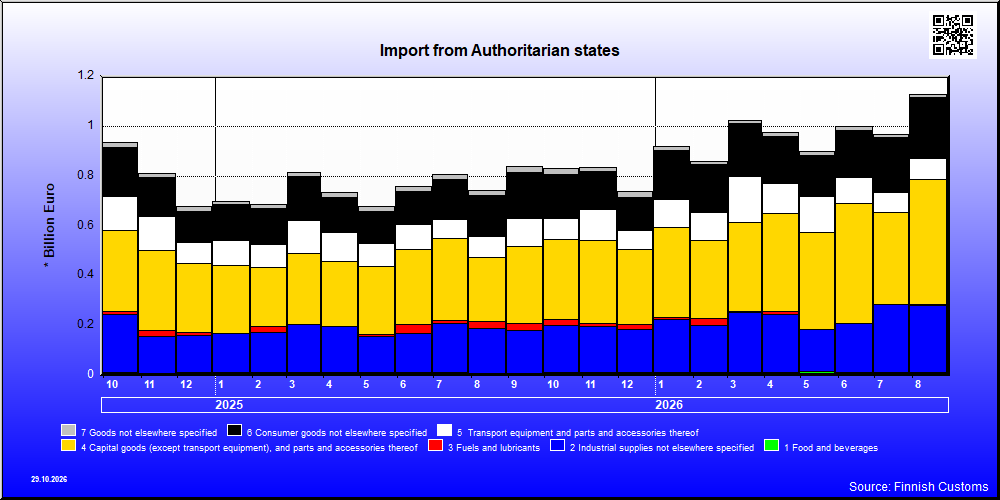
| 8 / 2026 | 8 / 2025 | Change from previous year's equal month % | ||
|---|---|---|---|---|
| 1,000 € | % | 1,000 € | ||
| 1. Food and beverages | 11,015 | 1.0 | 9,636 | 14.3 |
| 11. Food and beverages, primary | 5,158 | 0.5 | 5,468 | -5.7 |
| 111. Food and beverages, primary, mainly for industry | 2,251 | 0.2 | 1,565 | 43.8 |
| 112. Food and beverages, primary, mainly for household consumption | 2,908 | 0.3 | 3,903 | -25.5 |
| 12. Food and beverages, processed | 5,857 | 0.5 | 4,167 | 40.5 |
| 121. Food and beverages, processed, mainly for industry | 125 | 0.0 | 26 | 389.2 |
| 122. Food and beverages, processed, mainly for household consumption | 5,732 | 0.5 | 4,142 | 38.4 |
| 2. Industrial supplies not elsewhere specified | 271,208 | 24.1 | 178,983 | 51.5 |
| 21. Industrial supplies not elsewhere specified, primary | 6,451 | 0.6 | 3,855 | 67.3 |
| 22. Industrial supplies not elsewhere specified, processed | 264,757 | 23.5 | 175,128 | 51.2 |
| 3. Fuels and lubricants | 1,159 | 0.1 | 29,809 | -96.1 |
| 32. Fuels and lubricants, processed | 1,159 | 0.1 | 29,809 | -96.1 |
| 322. Fuels and lubricants, other | 1,159 | 0.1 | 29,809 | -96.1 |
| 4. Capital goods (except transport equipment), and parts and accessories thereof | 502,354 | 44.6 | 254,014 | 97.8 |
| 41. Capital goods (except transport equipment) | 366,184 | 32.5 | 190,760 | 92.0 |
| 42. Capital goods (except transport equipment), parts and accessories | 136,170 | 12.1 | 63,254 | 115.3 |
| 5. Transport equipment and parts and accessories thereof | 86,506 | 7.7 | 83,723 | 3.3 |
| 51. Passenger motor vehicles | 12,735 | 1.1 | 13,005 | -2.1 |
| 52. Transport equipment, other than passenger motor vehicles | 5,019 | 0.4 | 2,332 | 115.3 |
| 521. Transport equipment, other than passenger motor vehicles, industrial | 2,201 | 0.2 | 1,539 | 43.0 |
| 522. Transport equipment, other than passenger motor vehicles, non-industrial | 2,817 | 0.2 | 792 | 255.6 |
| 53. Transport equipment, parts and accessories | 68,753 | 6.1 | 68,387 | 0.5 |
| 6. Consumer goods not elsewhere specified | 245,314 | 21.8 | 165,644 | 48.1 |
| 61. Consumer goods not elsewhere specified, durable | 48,467 | 4.3 | 31,015 | 56.3 |
| 62. Consumer goods not elsewhere specified, semi-durable | 161,134 | 14.3 | 110,882 | 45.3 |
| 63. Consumer goods not elsewhere specified, non-durable | 35,713 | 3.2 | 23,747 | 50.4 |
| 7. Goods not elsewhere specified | 9,533 | 0.8 | 22,369 | -57.4 |
| All groups | 1,127,089 | 100.0 | 744,173 | 51.5 |
| Classification | Description | Year level | Quarter level | Month level | Year 2026 sofar |
|---|---|---|---|---|---|
| SITC | Standard International Trade Classification (classification system is maintained by the United Nations) | ███ | ███ | ███ | ███ |
| BEC | The standard of statistical classification of BEC (Broad Economic Categories) is upheld by the UN and it is based on SITC-nomenclature. | ███ | ███ | ███ | ███ |
| NACE | National industrial classification based on Statistical Classification of Economic Activities in the European Community Nomenclature générale des Activités économiques dans les Communautés européennes | ███ | ███ | ███ | ███ |
| CPA | CPA = Classification of Products by Activities | ███ | ███ | ███ | ███ |
| CN | The Combined Nomenclature is the common nomenclature of the European Community. | ███ | ███ | ███ | ███ |