
| Export of goods from Finland and import to Finland | BEC (Broad Economic Categories) |
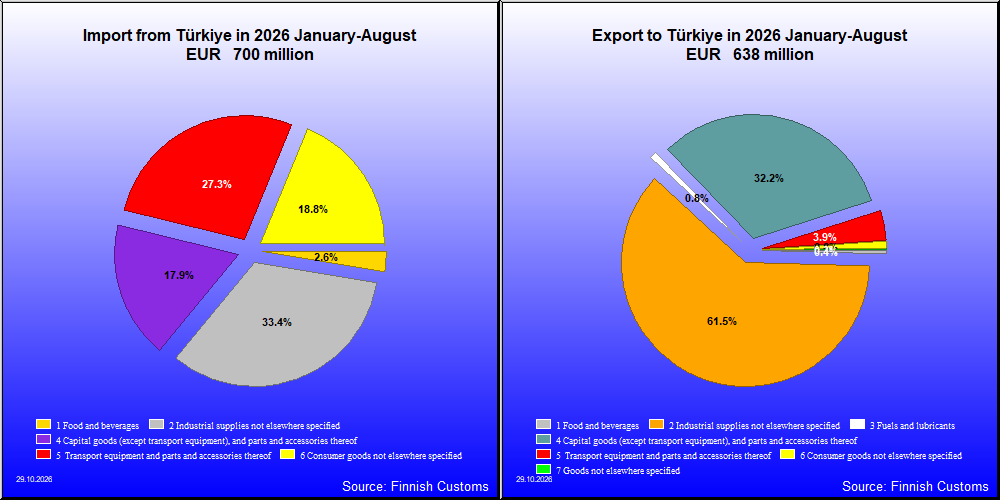
| 2026 1-8 1,000 € | 2025 1-8 1,000 € | Change % |
|
|---|---|---|---|
| 1. Food and beverages | 18,279 | 18,490 | -1.1 |
| 11. Food and beverages, primary | 5,894 | 4,326 | 36.2 |
| 111. Food and beverages, primary, mainly for industry | 45 | 123 | -63.3 |
| 112. Food and beverages, primary, mainly for household consumption | 5,849 | 4,203 | 39.2 |
| 12. Food and beverages, processed | 12,385 | 14,164 | -12.6 |
| 121. Food and beverages, processed, mainly for industry | 428 | 1,083 | -60.4 |
| 122. Food and beverages, processed, mainly for household consumption | 11,957 | 13,081 | -8.6 |
| 2. Industrial supplies not elsewhere specified | 233,752 | 161,053 | 45.1 |
| 21. Industrial supplies not elsewhere specified, primary | 43,084 | 28,343 | 52.0 |
| 22. Industrial supplies not elsewhere specified, processed | 190,669 | 132,710 | 43.7 |
| 3. Fuels and lubricants | 113 | 226 | -50.0 |
| 32. Fuels and lubricants, processed | 113 | 226 | -50.0 |
| 322. Fuels and lubricants, other | 113 | 226 | -50.0 |
| 4. Capital goods (except transport equipment), and parts and accessories thereof | 125,004 | 73,932 | 69.1 |
| 41. Capital goods (except transport equipment) | 62,676 | 32,751 | 91.4 |
| 42. Capital goods (except transport equipment), parts and accessories | 62,328 | 41,181 | 51.4 |
| 5. Transport equipment and parts and accessories thereof | 190,707 | 180,723 | 5.5 |
| 51. Passenger motor vehicles | 43,420 | 51,892 | -16.3 |
| 52. Transport equipment, other than passenger motor vehicles | 99,596 | 98,497 | 1.1 |
| 521. Transport equipment, other than passenger motor vehicles, industrial | 99,223 | 88,188 | 12.5 |
| 522. Transport equipment, other than passenger motor vehicles, non-industrial | 372 | 10,309 | -96.4 |
| 53. Transport equipment, parts and accessories | 47,692 | 30,334 | 57.2 |
| 6. Consumer goods not elsewhere specified | 131,715 | 131,991 | -0.2 |
| 61. Consumer goods not elsewhere specified, durable | 33,383 | 48,787 | -31.6 |
| 62. Consumer goods not elsewhere specified, semi-durable | 63,895 | 56,235 | 13.6 |
| 63. Consumer goods not elsewhere specified, non-durable | 34,438 | 26,969 | 27.7 |
| 7. Goods not elsewhere specified | 348 | 372 | -6.5 |
| All groups | 699,919 | 566,786 | 23.5 |
| Classification | Description | Year level | Quarter level | Month level | Year 2026 sofar |
|---|---|---|---|---|---|
| SITC | Standard International Trade Classification (classification system is maintained by the United Nations) | ███ | ███ | ███ | ███ |
| BEC | The standard of statistical classification of BEC (Broad Economic Categories) is upheld by the UN and it is based on SITC-nomenclature. | ███ | ███ | ███ | ███ |
| NACE | National industrial classification based on Statistical Classification of Economic Activities in the European Community Nomenclature générale des Activités économiques dans les Communautés européennes | ███ | ███ | ███ | ███ |
| CPA | CPA = Classification of Products by Activities | ███ | ███ | ███ | ███ |
| CN | The Combined Nomenclature is the common nomenclature of the European Community. | ███ | ███ | ███ | ███ |