
| Export of goods from Finland and import to Finland | BEC (Broad Economic Categories) |
*) The standard of statistical classification of BEC (Broad Economic Categories) is upheld by the UN and it is based on SITC-nomenclature.
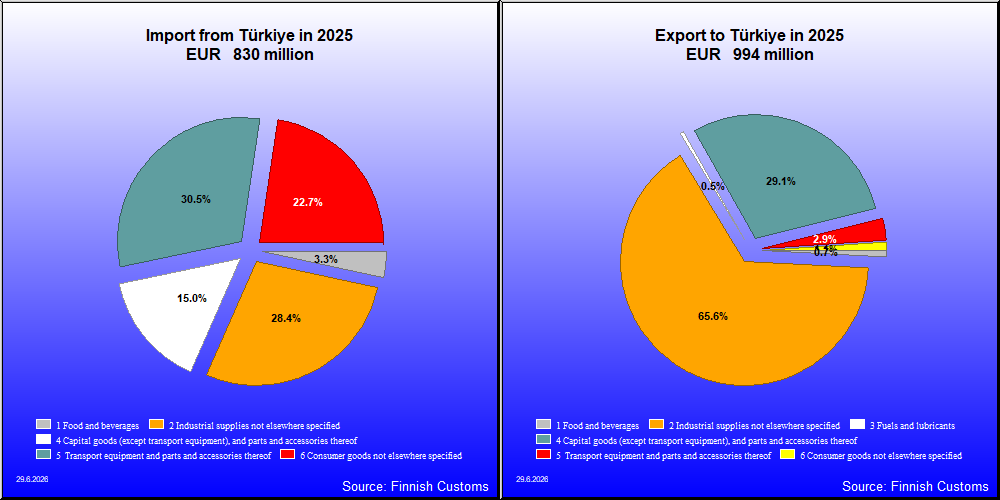

| 2021 | 2022 | 2023 | 2024 | 2025 | ||||||
|---|---|---|---|---|---|---|---|---|---|---|
| 1,000 € | % | 1,000 € | % | 1,000 € | % | 1,000 € | % | 1,000 € | % | |
| 1. Food and beverages | 1,025 | 0.1 | 2,708 | 0.2 | 2,880 | 0.2 | 2,469 | 0.3 | 7,254 | 0.7 |
| 11. Food and beverages, primary | 156 | 0.0 | 90 | 0.0 | 183 | 0.0 | 88 | 0.0 | ||
| 112. Food and beverages, primary, mainly for household consumption | 156 | 0.0 | 90 | 0.0 | 183 | 0.0 | 88 | 0.0 | ||
| 12. Food and beverages, processed | 1,025 | 0.1 | 2,552 | 0.2 | 2,790 | 0.2 | 2,286 | 0.2 | 7,167 | 0.7 |
| 121. Food and beverages, processed, mainly for industry | 466 | 0.0 | 1,275 | 0.1 | 1,330 | 0.1 | 1,416 | 0.1 | 1,838 | 0.2 |
| 122. Food and beverages, processed, mainly for household consumption | 559 | 0.1 | 1,277 | 0.1 | 1,460 | 0.1 | 870 | 0.1 | 5,328 | 0.5 |
| 2. Industrial supplies not elsewhere specified | 720,289 | 75.9 | 815,310 | 71.4 | 721,555 | 57.3 | 643,436 | 65.9 | 652,205 | 65.6 |
| 21. Industrial supplies not elsewhere specified, primary | 127,295 | 13.4 | 123,887 | 10.9 | 151,636 | 12.0 | 111,207 | 11.4 | 150,951 | 15.2 |
| 22. Industrial supplies not elsewhere specified, processed | 592,994 | 62.4 | 691,423 | 60.6 | 569,920 | 45.3 | 532,229 | 54.5 | 501,255 | 50.4 |
| 3. Fuels and lubricants | 2,060 | 0.2 | 5,467 | 0.5 | 3,918 | 0.3 | 2,986 | 0.3 | 4,737 | 0.5 |
| 31. Fuels and lubricants, primary | 1,992 | 0.2 | 2,774 | 0.2 | 2,678 | 0.2 | 2,842 | 0.3 | 3,385 | 0.3 |
| 32. Fuels and lubricants, processed | 68 | 0.0 | 2,693 | 0.2 | 1,240 | 0.1 | 144 | 0.0 | 1,352 | 0.1 |
| 321. Fuels and lubricants, motor spirit | 17 | 0.0 | 40 | 0.0 | ||||||
| 322. Fuels and lubricants, other | 51 | 0.0 | 2,693 | 0.2 | 1,200 | 0.1 | 144 | 0.0 | 1,352 | 0.1 |
| 4. Capital goods (except transport equipment), and parts and accessories thereof | 201,567 | 21.2 | 285,250 | 25.0 | 468,141 | 37.2 | 281,527 | 28.8 | 289,641 | 29.1 |
| 41. Capital goods (except transport equipment) | 144,799 | 15.2 | 207,216 | 18.2 | 366,482 | 29.1 | 200,489 | 20.5 | 204,230 | 20.5 |
| 42. Capital goods (except transport equipment), parts and accessories | 56,768 | 6.0 | 78,034 | 6.8 | 101,659 | 8.1 | 81,038 | 8.3 | 85,410 | 8.6 |
| 5. Transport equipment and parts and accessories thereof | 22,053 | 2.3 | 27,209 | 2.4 | 51,867 | 4.1 | 36,347 | 3.7 | 29,248 | 2.9 |
| 51. Passenger motor vehicles | 21 | 0.0 | 70 | 0.0 | 951 | 0.1 | 86 | 0.0 | 283 | 0.0 |
| 52. Transport equipment, other than passenger motor vehicles | 4,501 | 0.5 | 11,912 | 1.0 | 23,463 | 1.9 | 19,900 | 2.0 | 16,475 | 1.7 |
| 521. Transport equipment, other than passenger motor vehicles, industrial | 3,707 | 0.4 | 9,376 | 0.8 | 13,855 | 1.1 | 8,409 | 0.9 | 6,601 | 0.7 |
| 522. Transport equipment, other than passenger motor vehicles, non-industrial | 794 | 0.1 | 2,536 | 0.2 | 9,609 | 0.8 | 11,491 | 1.2 | 9,874 | 1.0 |
| 53. Transport equipment, parts and accessories | 17,531 | 1.8 | 15,227 | 1.3 | 27,453 | 2.2 | 16,361 | 1.7 | 12,489 | 1.3 |
| 6. Consumer goods not elsewhere specified | 2,532 | 0.3 | 5,370 | 0.5 | 10,072 | 0.8 | 6,686 | 0.7 | 11,057 | 1.1 |
| 61. Consumer goods not elsewhere specified, durable | 422 | 0.0 | 2,160 | 0.2 | 2,812 | 0.2 | 1,207 | 0.1 | 972 | 0.1 |
| 62. Consumer goods not elsewhere specified, semi-durable | 1,132 | 0.1 | 2,442 | 0.2 | 5,676 | 0.5 | 3,168 | 0.3 | 4,932 | 0.5 |
| 63. Consumer goods not elsewhere specified, non-durable | 978 | 0.1 | 767 | 0.1 | 1,583 | 0.1 | 2,311 | 0.2 | 5,153 | 0.5 |
| 7. Goods not elsewhere specified | 28 | 0.0 | 8 | 0.0 | 235 | 0.0 | 2,797 | 0.3 | 139 | 0.0 |
| All groups | 949,553 | 100.0 | 1,141,322 | 100.0 | 1,258,668 | 100.0 | 976,247 | 100.0 | 994,281 | 100.0 |

| 2021 | 2022 | 2023 | 2024 | 2025 | ||||||
|---|---|---|---|---|---|---|---|---|---|---|
| 1,000 € | % | 1,000 € | % | 1,000 € | % | 1,000 € | % | 1,000 € | % | |
| 1. Food and beverages | 16,353 | 2.3 | 21,303 | 2.2 | 24,381 | 2.5 | 28,313 | 3.3 | 27,389 | 3.3 |
| 11. Food and beverages, primary | 5,705 | 0.8 | 6,256 | 0.6 | 6,328 | 0.7 | 8,636 | 1.0 | 6,862 | 0.8 |
| 111. Food and beverages, primary, mainly for industry | 154 | 0.0 | 281 | 0.0 | 328 | 0.0 | 442 | 0.1 | 137 | 0.0 |
| 112. Food and beverages, primary, mainly for household consumption | 5,551 | 0.8 | 5,975 | 0.6 | 6,000 | 0.6 | 8,195 | 0.9 | 6,725 | 0.8 |
| 12. Food and beverages, processed | 10,648 | 1.5 | 15,047 | 1.5 | 18,053 | 1.9 | 19,677 | 2.3 | 20,527 | 2.5 |
| 121. Food and beverages, processed, mainly for industry | 739 | 0.1 | 798 | 0.1 | 1,206 | 0.1 | 1,482 | 0.2 | 1,481 | 0.2 |
| 122. Food and beverages, processed, mainly for household consumption | 9,908 | 1.4 | 14,249 | 1.4 | 16,847 | 1.7 | 18,195 | 2.1 | 19,046 | 2.3 |
| 2. Industrial supplies not elsewhere specified | 251,542 | 34.8 | 390,436 | 39.6 | 415,918 | 43.1 | 263,654 | 30.4 | 235,847 | 28.4 |
| 21. Industrial supplies not elsewhere specified, primary | 38,442 | 5.3 | 34,671 | 3.5 | 35,632 | 3.7 | 41,382 | 4.8 | 46,997 | 5.7 |
| 22. Industrial supplies not elsewhere specified, processed | 213,101 | 29.5 | 355,765 | 36.0 | 380,285 | 39.4 | 222,272 | 25.6 | 188,850 | 22.7 |
| 3. Fuels and lubricants | 5,136 | 0.7 | 273 | 0.0 | 285 | 0.0 | 36,407 | 4.2 | 324 | 0.0 |
| 32. Fuels and lubricants, processed | 5,136 | 0.7 | 273 | 0.0 | 285 | 0.0 | 36,407 | 4.2 | 324 | 0.0 |
| 321. Fuels and lubricants, motor spirit | 5,128 | 0.7 | ||||||||
| 322. Fuels and lubricants, other | 8 | 0.0 | 273 | 0.0 | 285 | 0.0 | 36,407 | 4.2 | 324 | 0.0 |
| 4. Capital goods (except transport equipment), and parts and accessories thereof | 81,014 | 11.2 | 186,277 | 18.9 | 156,432 | 16.2 | 114,110 | 13.1 | 124,735 | 15.0 |
| 41. Capital goods (except transport equipment) | 31,137 | 4.3 | 43,599 | 4.4 | 43,024 | 4.5 | 47,860 | 5.5 | 52,652 | 6.3 |
| 42. Capital goods (except transport equipment), parts and accessories | 49,877 | 6.9 | 142,677 | 14.5 | 113,408 | 11.7 | 66,249 | 7.6 | 72,084 | 8.7 |
| 5. Transport equipment and parts and accessories thereof | 193,918 | 26.8 | 187,837 | 19.0 | 181,214 | 18.8 | 229,129 | 26.4 | 252,997 | 30.5 |
| 51. Passenger motor vehicles | 71,908 | 9.9 | 57,554 | 5.8 | 57,298 | 5.9 | 69,819 | 8.0 | 71,583 | 8.6 |
| 52. Transport equipment, other than passenger motor vehicles | 83,037 | 11.5 | 75,486 | 7.6 | 72,371 | 7.5 | 108,451 | 12.5 | 133,773 | 16.1 |
| 521. Transport equipment, other than passenger motor vehicles, industrial | 67,698 | 9.4 | 46,642 | 4.7 | 50,785 | 5.3 | 91,639 | 10.6 | 122,989 | 14.8 |
| 522. Transport equipment, other than passenger motor vehicles, non-industrial | 15,338 | 2.1 | 28,844 | 2.9 | 21,586 | 2.2 | 16,812 | 1.9 | 10,784 | 1.3 |
| 53. Transport equipment, parts and accessories | 38,974 | 5.4 | 54,797 | 5.6 | 51,544 | 5.3 | 50,860 | 5.9 | 47,641 | 5.7 |
| 6. Consumer goods not elsewhere specified | 161,027 | 22.3 | 188,934 | 19.1 | 187,122 | 19.4 | 195,973 | 22.6 | 188,388 | 22.7 |
| 61. Consumer goods not elsewhere specified, durable | 49,924 | 6.9 | 52,030 | 5.3 | 63,304 | 6.6 | 59,905 | 6.9 | 67,478 | 8.1 |
| 62. Consumer goods not elsewhere specified, semi-durable | 78,952 | 10.9 | 95,428 | 9.7 | 83,110 | 8.6 | 89,781 | 10.3 | 80,810 | 9.7 |
| 63. Consumer goods not elsewhere specified, non-durable | 32,151 | 4.4 | 41,476 | 4.2 | 40,709 | 4.2 | 46,287 | 5.3 | 40,100 | 4.8 |
| 7. Goods not elsewhere specified | 14,521 | 2.0 | 12,067 | 1.2 | 688 | 0.1 | 759 | 0.1 | 541 | 0.1 |
| All groups | 723,511 | 100.0 | 987,127 | 100.0 | 966,039 | 100.0 | 868,345 | 100.0 | 830,221 | 100.0 |
| Classification | Description | Year level | Quarter level | Month level | |
|---|---|---|---|---|---|
| SITC | Standard International Trade Classification (classification system is maintained by the United Nations) | ███ | ███ | ███ | |
| BEC | The standard of statistical classification of BEC (Broad Economic Categories) is upheld by the UN and it is based on SITC-nomenclature. | ███ | ███ | ███ | |
| NACE | National industrial classification based on Statistical Classification of Economic Activities in the European Community Nomenclature générale des Activités économiques dans les Communautés européennes | ███ | ███ | ███ | |
| CPA | CPA = Classification of Products by Activities | ███ | ███ | ███ | |
| CN | The Combined Nomenclature is the common nomenclature of the European Community. | ███ | ███ | ███ |