
| Export of goods from Finland and import to Finland | Trade Balance |

| Year | Month | Import 1,000 € | Export 1,000 € | Trade 1,000 € | Trade Balance 1,000 € |
|---|---|---|---|---|---|
| 2023 | 1 | 10,839 | 9,287 | 20,125 | -1,552 |
| 2023 | 2 | 13,078 | 8,356 | 21,434 | -4,722 |
| 2023 | 3 | 14,150 | 9,920 | 24,070 | -4,230 |
| 2023 | 4 | 11,947 | 10,528 | 22,475 | -1,419 |
| 2023 | 5 | 11,535 | 8,773 | 20,309 | -2,762 |
| 2023 | 6 | 16,220 | 14,244 | 30,463 | -1,976 |
| 2023 | 7 | 10,245 | 17,414 | 27,658 | 7,169 |
| 2023 | 8 | 10,805 | 15,114 | 25,919 | 4,310 |
| 2023 | 9 | 9,752 | 6,207 | 15,959 | -3,546 |
| 2023 | 10 | 12,458 | 10,056 | 22,513 | -2,402 |
| 2023 | 11 | 12,776 | 7,223 | 19,998 | -5,553 |
| 2023 | 12 | 15,183 | 5,923 | 21,106 | -9,260 |
| 2024 | 1 | 12,129 | 7,284 | 19,413 | -4,844 |
| 2024 | 2 | 13,284 | 8,361 | 21,645 | -4,923 |
| 2024 | 3 | 11,075 | 6,307 | 17,382 | -4,767 |
| 2024 | 4 | 11,492 | 7,237 | 18,728 | -4,255 |
| 2024 | 5 | 15,007 | 6,647 | 21,654 | -8,360 |
| 2024 | 6 | 12,504 | 5,354 | 17,858 | -7,151 |
| 2024 | 7 | 12,438 | 4,682 | 17,120 | -7,757 |
| 2024 | 8 | 10,474 | 7,450 | 17,924 | -3,024 |
| 2024 | 9 | 14,688 | 7,072 | 21,760 | -7,616 |
| 2024 | 10 | 13,916 | 9,301 | 23,217 | -4,615 |
| 2024 | 11 | 11,978 | 9,203 | 21,180 | -2,775 |
| 2024 | 12 | 11,910 | 5,229 | 17,139 | -6,681 |
| 2025 | 1 | 11,604 | 5,534 | 17,138 | -6,070 |
| 2025 | 2 | 12,653 | 6,764 | 19,416 | -5,889 |
| 2025 | 3 | 13,108 | 7,752 | 20,860 | -5,356 |
| 2025 | 4 | 15,344 | 7,114 | 22,458 | -8,231 |
| 2025 | 5 | 12,169 | 7,129 | 19,299 | -5,040 |
| 2025 | 6 | 15,943 | 8,138 | 24,082 | -7,805 |
| 2025 | 7 | 15,086 | 7,794 | 22,880 | -7,293 |
| 2025 | 8 | 12,949 | 6,485 | 19,434 | -6,464 |
| 2025 | 9 | 14,846 | 9,937 | 24,783 | -4,908 |
| 2025 | 10 | 13,762 | 8,448 | 22,210 | -5,315 |
| 2025 | 11 | 15,508 | 6,566 | 22,075 | -8,942 |
| 2025 | 12 | 16,435 | 4,631 | 21,066 | -11,804 |
| 2026 | 1 | 18,799 | 6,479 | 25,278 | -12,320 |
| 2026 | 2 | 18,068 | 7,200 | 25,268 | -10,867 |
| 2026 | 3 | 19,226 | 7,624 | 26,850 | -11,602 |
| 2026 | 4 | 20,426 | 6,007 | 26,432 | -14,419 |
| 2026 | 5 | 13,289 | 8,750 | 22,039 | -4,539 |
| 2026 | 6 | 21,025 | 9,351 | 30,375 | -11,674 |
| 2026 | 7 | 16,511 | 6,165 | 22,677 | -10,346 |
| 2026 | 8 | 17,759 | 5,167 | 22,926 | -12,592 |
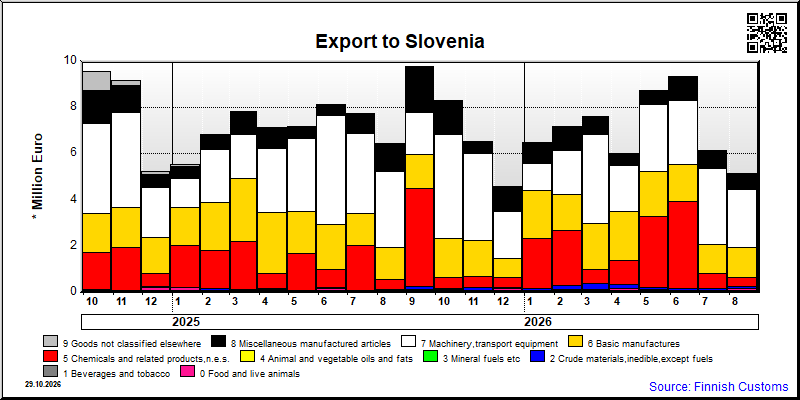
| 2026/4 | 2026/5 | 2026/6 | 2026/7 | 2026/8 | ||||||
|---|---|---|---|---|---|---|---|---|---|---|
| 1000 € | % | 1000 € | % | 1000 € | % | 1000 € | % | 1000 € | % | |
| 0. Food and live animals | 172 | 2.9 | 132 | 1.5 | 84 | 0.9 | 69 | 1.1 | 185 | 3.6 |
| 1. Beverages and tobacco | 6 | 0.1 | 6 | 0.1 | ||||||
| 2. Crude materials,inedible,except fuels | 183 | 3.0 | 86 | 1.0 | 78 | 0.8 | 92 | 1.5 | 80 | 1.6 |
| 3. Mineral fuels etc | 4 | 0.0 | 2 | 0.0 | ||||||
| 5. Chemicals and related products,n.e.s. | 1,025 | 17.1 | 3,072 | 35.1 | 3,791 | 40.5 | 652 | 10.6 | 372 | 7.2 |
| 6. Basic manufactures | 2,099 | 34.9 | 1,940 | 22.2 | 1,570 | 16.8 | 1,241 | 20.1 | 1,327 | 25.7 |
| 7. Machinery,transport equipment | 2,000 | 33.3 | 2,894 | 33.1 | 2,802 | 30.0 | 3,302 | 53.6 | 2,478 | 48.0 |
| 8. Miscellaneous manufactured articles | 484 | 8.1 | 580 | 6.6 | 987 | 10.6 | 769 | 12.5 | 688 | 13.3 |
| 9. Goods not classified elsewhere | 37 | 0.6 | 37 | 0.4 | 37 | 0.4 | 37 | 0.6 | 37 | 0.7 |
| All groups combined | 6,007 | 100.0 | 8,750 | 100.0 | 9,351 | 100.0 | 6,165 | 100.0 | 5,167 | 100.0 |

| 2026/4 | 2026/5 | 2026/6 | 2026/7 | 2026/8 | ||||||
|---|---|---|---|---|---|---|---|---|---|---|
| 1000 € | % | 1000 € | % | 1000 € | % | 1000 € | % | 1000 € | % | |
| 0. Food and live animals | 836 | 4.1 | 972 | 7.3 | 696 | 3.3 | 945 | 5.7 | 1,090 | 6.1 |
| 1. Beverages and tobacco | 4 | 0.0 | 4 | 0.0 | 3 | 0.0 | ||||
| 2. Crude materials,inedible,except fuels | 77 | 0.4 | 53 | 0.4 | 75 | 0.4 | 52 | 0.3 | 63 | 0.4 |
| 3. Mineral fuels etc | 135 | 0.7 | 139 | 1.0 | 147 | 0.7 | 126 | 0.8 | 138 | 0.8 |
| 5. Chemicals and related products,n.e.s. | 10,193 | 49.9 | 4,437 | 33.4 | 9,150 | 43.5 | 8,015 | 48.5 | 8,185 | 46.1 |
| 6. Basic manufactures | 2,892 | 14.2 | 2,494 | 18.8 | 2,163 | 10.3 | 1,915 | 11.6 | 1,801 | 10.1 |
| 7. Machinery,transport equipment | 4,928 | 24.1 | 4,357 | 32.8 | 7,819 | 37.2 | 4,668 | 28.3 | 5,978 | 33.7 |
| 8. Miscellaneous manufactured articles | 1,360 | 6.7 | 834 | 6.3 | 973 | 4.6 | 788 | 4.8 | 491 | 2.8 |
| 9. Goods not classified elsewhere | 1 | 0.0 | 2 | 0.0 | 14 | 0.1 | ||||
| All groups combined | 20,426 | 100.0 | 13,289 | 100.0 | 21,025 | 100.0 | 16,511 | 100.0 | 17,759 | 100.0 |
| Classification | Description | Year level | Quarter level | Month level | Year 2026 sofar |
|---|---|---|---|---|---|
| SITC | Standard International Trade Classification (classification system is maintained by the United Nations) | ███ | ███ | ███ | ███ |
| BEC | The standard of statistical classification of BEC (Broad Economic Categories) is upheld by the UN and it is based on SITC-nomenclature. | ███ | ███ | ███ | ███ |
| NACE | National industrial classification based on Statistical Classification of Economic Activities in the European Community Nomenclature générale des Activités économiques dans les Communautés européennes | ███ | ███ | ███ | ███ |
| CPA | CPA = Classification of Products by Activities | ███ | ███ | ███ | ███ |
| CN | The Combined Nomenclature is the common nomenclature of the European Community. | ███ | ███ | ███ | ███ |