
| Export of goods from Finland and import to Finland | BEC (Broad Economic Categories) |
*) The standard of statistical classification of BEC (Broad Economic Categories) is upheld by the UN and it is based on SITC-nomenclature.


| 2021 | 2022 | 2023 | 2024 | 2025 | ||||||
|---|---|---|---|---|---|---|---|---|---|---|
| 1,000 € | % | 1,000 € | % | 1,000 € | % | 1,000 € | % | 1,000 € | % | |
| 1. Food and beverages | 995 | 1.3 | 1,176 | 1.3 | 1,378 | 1.1 | 1,296 | 1.5 | 1,307 | 1.5 |
| 12. Food and beverages, processed | 995 | 1.3 | 1,176 | 1.3 | 1,378 | 1.1 | 1,296 | 1.5 | 1,307 | 1.5 |
| 121. Food and beverages, processed, mainly for industry | 7 | 0.0 | 14 | 0.0 | 31 | 0.0 | 13 | 0.0 | ||
| 122. Food and beverages, processed, mainly for household consumption | 988 | 1.3 | 1,162 | 1.3 | 1,347 | 1.1 | 1,296 | 1.5 | 1,294 | 1.5 |
| 2. Industrial supplies not elsewhere specified | 32,323 | 40.9 | 40,664 | 45.8 | 40,710 | 33.1 | 26,091 | 30.9 | 27,150 | 31.5 |
| 21. Industrial supplies not elsewhere specified, primary | 61 | 0.1 | 62 | 0.1 | 31 | 0.0 | 28 | 0.0 | 75 | 0.1 |
| 22. Industrial supplies not elsewhere specified, processed | 32,262 | 40.8 | 40,602 | 45.7 | 40,679 | 33.1 | 26,063 | 30.8 | 27,075 | 31.5 |
| 3. Fuels and lubricants | 1 | 0.0 | 29 | 0.0 | 70 | 0.1 | 32 | 0.0 | 38 | 0.0 |
| 32. Fuels and lubricants, processed | 1 | 0.0 | 29 | 0.0 | 70 | 0.1 | 32 | 0.0 | 38 | 0.0 |
| 322. Fuels and lubricants, other | 1 | 0.0 | 29 | 0.0 | 70 | 0.1 | 32 | 0.0 | 38 | 0.0 |
| 4. Capital goods (except transport equipment), and parts and accessories thereof | 28,639 | 36.2 | 25,730 | 29.0 | 56,139 | 45.6 | 30,786 | 36.4 | 29,819 | 34.6 |
| 41. Capital goods (except transport equipment) | 24,235 | 30.7 | 21,573 | 24.3 | 26,402 | 21.5 | 24,377 | 28.8 | 18,234 | 21.2 |
| 42. Capital goods (except transport equipment), parts and accessories | 4,404 | 5.6 | 4,157 | 4.7 | 29,738 | 24.2 | 6,409 | 7.6 | 11,585 | 13.5 |
| 5. Transport equipment and parts and accessories thereof | 3,195 | 4.0 | 6,703 | 7.5 | 9,089 | 7.4 | 8,376 | 9.9 | 9,815 | 11.4 |
| 51. Passenger motor vehicles | 276 | 0.3 | 330 | 0.4 | ||||||
| 52. Transport equipment, other than passenger motor vehicles | 2,669 | 3.4 | 5,391 | 6.1 | 8,675 | 7.0 | 7,873 | 9.3 | 8,756 | 10.2 |
| 521. Transport equipment, other than passenger motor vehicles, industrial | 2,590 | 3.3 | 2,516 | 2.8 | 4,370 | 3.6 | 3,475 | 4.1 | 3,076 | 3.6 |
| 522. Transport equipment, other than passenger motor vehicles, non-industrial | 79 | 0.1 | 2,876 | 3.2 | 4,304 | 3.5 | 4,398 | 5.2 | 5,680 | 6.6 |
| 53. Transport equipment, parts and accessories | 526 | 0.7 | 1,036 | 1.2 | 414 | 0.3 | 503 | 0.6 | 729 | 0.8 |
| 6. Consumer goods not elsewhere specified | 10,080 | 12.7 | 11,815 | 13.3 | 14,275 | 11.6 | 15,279 | 18.1 | 17,010 | 19.8 |
| 61. Consumer goods not elsewhere specified, durable | 669 | 0.8 | 443 | 0.5 | 500 | 0.4 | 707 | 0.8 | 661 | 0.8 |
| 62. Consumer goods not elsewhere specified, semi-durable | 4,822 | 6.1 | 6,265 | 7.1 | 4,889 | 4.0 | 4,288 | 5.1 | 4,368 | 5.1 |
| 63. Consumer goods not elsewhere specified, non-durable | 4,589 | 5.8 | 5,106 | 5.7 | 8,886 | 7.2 | 10,283 | 12.2 | 11,980 | 13.9 |
| 7. Goods not elsewhere specified | 3,827 | 4.8 | 2,749 | 3.1 | 1,405 | 1.1 | 2,690 | 3.2 | 933 | 1.1 |
| All groups | 79,058 | 100.0 | 88,866 | 100.0 | 123,067 | 100.0 | 84,550 | 100.0 | 86,071 | 100.0 |
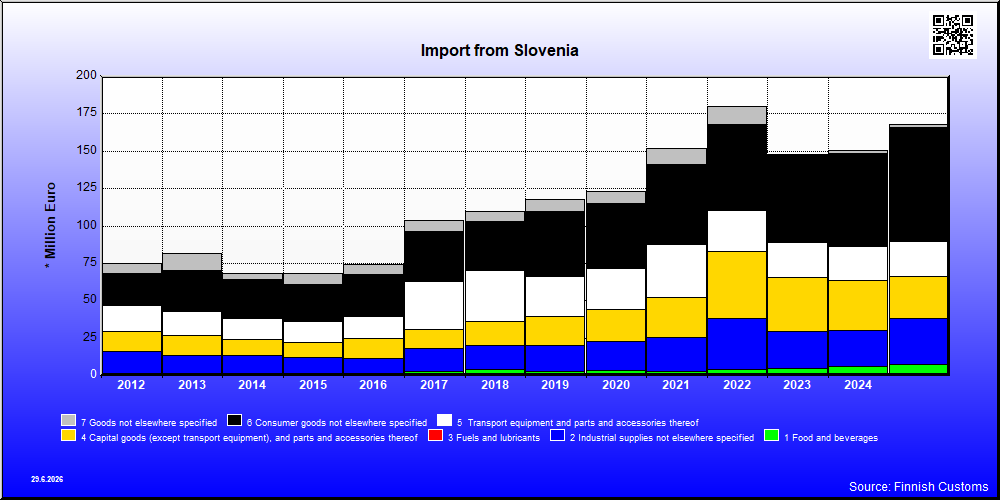
| 2021 | 2022 | 2023 | 2024 | 2025 | ||||||
|---|---|---|---|---|---|---|---|---|---|---|
| 1,000 € | % | 1,000 € | % | 1,000 € | % | 1,000 € | % | 1,000 € | % | |
| 1. Food and beverages | 2,913 | 1.9 | 3,684 | 2.0 | 4,904 | 3.3 | 5,689 | 3.8 | 7,346 | 4.4 |
| 11. Food and beverages, primary | 2,426 | 1.6 | 3,203 | 1.8 | 3,704 | 2.5 | 3,474 | 2.3 | 6,050 | 3.6 |
| 111. Food and beverages, primary, mainly for industry | 8 | 0.0 | 3 | 0.0 | ||||||
| 112. Food and beverages, primary, mainly for household consumption | 2,426 | 1.6 | 3,203 | 1.8 | 3,704 | 2.5 | 3,466 | 2.3 | 6,047 | 3.6 |
| 12. Food and beverages, processed | 486 | 0.3 | 481 | 0.3 | 1,200 | 0.8 | 2,215 | 1.5 | 1,296 | 0.8 |
| 121. Food and beverages, processed, mainly for industry | 36 | 0.0 | 70 | 0.0 | 40 | 0.0 | ||||
| 122. Food and beverages, processed, mainly for household consumption | 486 | 0.3 | 444 | 0.2 | 1,129 | 0.8 | 2,175 | 1.4 | 1,296 | 0.8 |
| 2. Industrial supplies not elsewhere specified | 22,700 | 14.9 | 34,173 | 19.0 | 24,500 | 16.6 | 24,314 | 16.2 | 30,493 | 18.1 |
| 21. Industrial supplies not elsewhere specified, primary | 307 | 0.2 | 7 | 0.0 | 22 | 0.0 | ||||
| 22. Industrial supplies not elsewhere specified, processed | 22,393 | 14.7 | 34,173 | 19.0 | 24,493 | 16.6 | 24,314 | 16.2 | 30,471 | 18.1 |
| 3. Fuels and lubricants | 30 | 0.0 | 4 | 0.0 | 2 | 0.0 | 5 | 0.0 | 7 | 0.0 |
| 32. Fuels and lubricants, processed | 30 | 0.0 | 4 | 0.0 | 2 | 0.0 | 5 | 0.0 | 7 | 0.0 |
| 321. Fuels and lubricants, motor spirit | 29 | 0.0 | ||||||||
| 322. Fuels and lubricants, other | 1 | 0.0 | 4 | 0.0 | 2 | 0.0 | 5 | 0.0 | 7 | 0.0 |
| 4. Capital goods (except transport equipment), and parts and accessories thereof | 26,611 | 17.5 | 45,280 | 25.2 | 36,240 | 24.5 | 33,409 | 22.2 | 28,200 | 16.8 |
| 41. Capital goods (except transport equipment) | 17,242 | 11.4 | 33,823 | 18.8 | 24,121 | 16.3 | 21,795 | 14.5 | 16,357 | 9.7 |
| 42. Capital goods (except transport equipment), parts and accessories | 9,369 | 6.2 | 11,457 | 6.4 | 12,119 | 8.2 | 11,614 | 7.7 | 11,843 | 7.0 |
| 5. Transport equipment and parts and accessories thereof | 35,389 | 23.3 | 27,401 | 15.2 | 23,555 | 15.9 | 22,811 | 15.2 | 23,864 | 14.2 |
| 51. Passenger motor vehicles | 12,741 | 8.4 | 7,913 | 4.4 | 10,671 | 7.2 | 10,795 | 7.2 | 8,853 | 5.3 |
| 52. Transport equipment, other than passenger motor vehicles | 4,263 | 2.8 | 4,820 | 2.7 | 4,993 | 3.4 | 1,716 | 1.1 | 3,320 | 2.0 |
| 521. Transport equipment, other than passenger motor vehicles, industrial | 871 | 0.6 | 447 | 0.2 | 565 | 0.4 | 698 | 0.5 | 894 | 0.5 |
| 522. Transport equipment, other than passenger motor vehicles, non-industrial | 3,392 | 2.2 | 4,372 | 2.4 | 4,428 | 3.0 | 1,018 | 0.7 | 2,427 | 1.4 |
| 53. Transport equipment, parts and accessories | 18,385 | 12.1 | 14,668 | 8.2 | 7,892 | 5.3 | 10,300 | 6.9 | 11,690 | 6.9 |
| 6. Consumer goods not elsewhere specified | 53,353 | 35.1 | 57,083 | 31.7 | 58,638 | 39.7 | 62,555 | 41.6 | 76,200 | 45.3 |
| 61. Consumer goods not elsewhere specified, durable | 20,297 | 13.4 | 16,717 | 9.3 | 17,311 | 11.7 | 16,969 | 11.3 | 15,696 | 9.3 |
| 62. Consumer goods not elsewhere specified, semi-durable | 5,409 | 3.6 | 4,870 | 2.7 | 3,917 | 2.6 | 3,240 | 2.2 | 6,883 | 4.1 |
| 63. Consumer goods not elsewhere specified, non-durable | 27,647 | 18.2 | 35,496 | 19.7 | 37,409 | 25.3 | 42,346 | 28.2 | 53,621 | 31.9 |
| 7. Goods not elsewhere specified | 10,898 | 7.2 | 12,167 | 6.8 | 13 | 0.0 | 1,417 | 0.9 | 2,094 | 1.2 |
| All groups | 151,895 | 100.0 | 179,793 | 100.0 | 147,851 | 100.0 | 150,200 | 100.0 | 168,204 | 100.0 |
| Classification | Description | Year level | Quarter level | Month level | |
|---|---|---|---|---|---|
| SITC | Standard International Trade Classification (classification system is maintained by the United Nations) | ███ | ███ | ███ | |
| BEC | The standard of statistical classification of BEC (Broad Economic Categories) is upheld by the UN and it is based on SITC-nomenclature. | ███ | ███ | ███ | |
| NACE | National industrial classification based on Statistical Classification of Economic Activities in the European Community Nomenclature générale des Activités économiques dans les Communautés européennes | ███ | ███ | ███ | |
| CPA | CPA = Classification of Products by Activities | ███ | ███ | ███ | |
| CN | The Combined Nomenclature is the common nomenclature of the European Community. | ███ | ███ | ███ |