
| Export of goods from Finland and import to Finland | Trade Balance |

| Year | Import 1,000 € | Export 1,000 € | Trade 1,000 € | Trade balance 1,000 € |
|---|---|---|---|---|
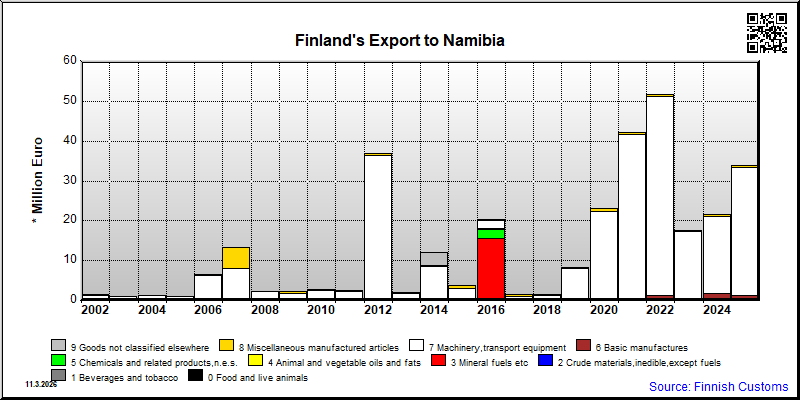
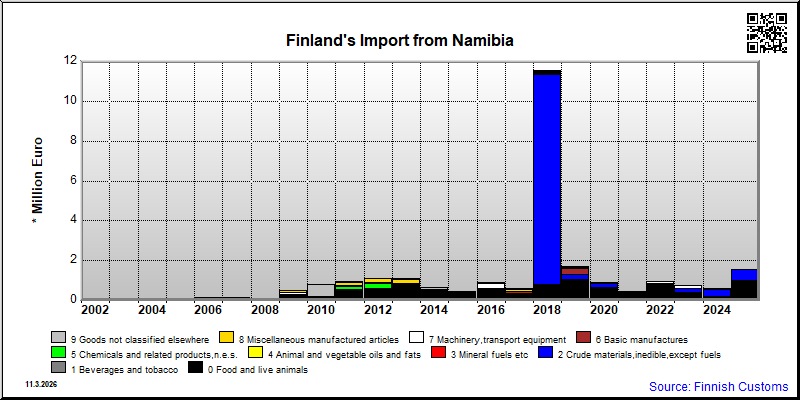
| 2002 | 21 | 1,387 | 1,408 | 1,366 |
| 2003 | 76 | 1,048 | 1,124 | 972 |
| 2004 | 28 | 1,254 | 1,283 | 1,226 |
| 2005 | 56 | 980 | 1,035 | 924 |
| 2006 | 135 | 6,464 | 6,599 | 6,329 |
| 2007 | 149 | 13,253 | 13,402 | 13,103 |
| 2008 | 80 | 2,377 | 2,457 | 2,297 |
| 2009 | 524 | 2,158 | 2,682 | 1,634 |
| 2010 | 790 | 2,683 | 3,474 | 1,893 |
| 2011 | 974 | 2,420 | 3,394 | 1,446 |
| 2012 | 1,102 | 36,848 | 37,951 | 35,746 |
| 2013 | 1,086 | 2,129 | 3,214 | 1,043 |
| 2014 | 574 | 11,962 | 12,536 | 11,387 |
| 2015 | 421 | 3,747 | 4,168 | 3,327 |
| 2016 | 927 | 20,234 | 21,160 | 19,307 |
| 2017 | 569 | 1,544 | 2,114 | 975 |
| 2018 | 11,535 | 1,509 | 13,044 | -10,025 |
| 2019 | 1,701 | 8,372 | 10,072 | 6,671 |
| 2020 | 901 | 23,069 | 23,970 | 22,168 |
| 2021 | 456 | 42,012 | 42,469 | 41,556 |
| 2022 | 948 | 53,401 | 54,348 | 52,453 |
| 2023 | 745 | 17,576 | 18,320 | 16,831 |
| 2024 | 601 | 21,617 | 22,218 | 21,016 |
| 2025 | 1,567 | 34,013 | 35,581 | 32,446 |
*) SITC = Standard International Trade Classification (classification system is maintained by the United Nations)

| 2021 | 2022 | 2023 | 2024 | 2025 | ||||||
|---|---|---|---|---|---|---|---|---|---|---|
| 1,000 € | % | 1,000 € | % | 1,000 € | % | 1,000 € | % | 1,000 € | % | |
| 2. Crude materials,inedible,except fuels | 2 | 0.0 | ||||||||
| 29. Crude animal,vegetable materials n.e.s. | 2 | 0.0 | ||||||||
| 3. Mineral fuels etc | 1 | 0.0 | ||||||||
| 33. Petroleum and products | 1 | 0.0 | ||||||||
| 5. Chemicals and related products,n.e.s. | 77 | 0.2 | 61 | 0.1 | 100 | 0.6 | 9 | 0.0 | 38 | 0.1 |
| 52. Inorganic chemicals | 1 | 0.0 | 33 | 0.1 | ||||||
| 54. Medicinal and pharmaceutical products | 58 | 0.1 | ||||||||
| 59. Chemical materials and products,n.e.s. | 77 | 0.2 | 2 | 0.0 | 99 | 0.6 | 9 | 0.0 | 4 | 0.0 |
| 6. Basic manufactures | 476 | 1.1 | 1,089 | 2.1 | 383 | 2.2 | 1,657 | 7.7 | 1,213 | 3.6 |
| 61. Leather,dressed fur,etc. | 1 | 0.0 | ||||||||
| 62. Rubber manufactures,n.e.s. | 4 | 0.0 | 4 | 0.0 | 11 | 0.1 | 3 | 0.0 | 172 | 0.5 |
| 64. Paper,paperboard and articles thereof | 319 | 0.8 | 1,081 | 2.1 | 336 | 1.9 | 1,432 | 6.6 | 846 | 2.5 |
| 65. Textile yarn,fabrics,made up articles,etc. | 15 | 0.0 | ||||||||
| 66. Non-metallic mineral manufactures,n.e.s. | 126 | 0.3 | 9 | 0.1 | 17 | 0.1 | 1 | 0.0 | ||
| 67. Iron and steel | 5 | 0.0 | 14 | 0.1 | 118 | 0.5 | 94 | 0.3 | ||
| 69. Manufactures of metals,n.e.s. | 6 | 0.0 | 4 | 0.0 | 13 | 0.1 | 87 | 0.4 | 100 | 0.3 |
| 7. Machinery,transport equipment | 41,210 | 97.8 | 50,002 | 96.5 | 16,881 | 96.0 | 19,473 | 90.1 | 32,254 | 94.8 |
| 71. Power generating machinery and equipment | 97 | 0.2 | 11 | 0.1 | 30 | 0.1 | 4 | 0.0 | ||
| 72. Machinery for specialized industries | 21,543 | 51.1 | 27,215 | 52.5 | 11,171 | 63.6 | 15,533 | 71.9 | 25,859 | 76.0 |
| 74. General industrial machinery n.e.s. | 76 | 0.2 | 191 | 0.4 | 377 | 2.1 | 416 | 1.9 | 2,374 | 7.0 |
| 75. Office machines and adp machines | 2 | 0.0 | 6 | 0.0 | 31 | 0.2 | ||||
| 76. Telecommunications and sound recording equipment | 24 | 0.1 | 8 | 0.0 | 2 | 0.0 | 1 | 0.0 | ||
| 77. Electric machinery,n.e.s.and parts | 70 | 0.2 | 480 | 0.9 | 282 | 1.6 | 107 | 0.5 | 345 | 1.0 |
| 78. Road vehicles | 19,399 | 46.0 | 22,102 | 42.7 | 5,007 | 28.5 | 4,536 | 21.0 | 3,671 | 10.8 |
| 79. Other transport equipment | 12 | 0.1 | ||||||||
| 8. Miscellaneous manufactured articles | 375 | 0.9 | 662 | 1.3 | 211 | 1.2 | 476 | 2.2 | 508 | 1.5 |
| 81. Prefabr.buildings;sanitary,lighting etc.fixtrs | 5 | 0.0 | 368 | 0.7 | 10 | 0.0 | ||||
| 83. Travel goods,handbags and sim.containers | 1 | 0.0 | ||||||||
| 84. Articles of apparel and clothing accessories | 81 | 0.2 | ||||||||
| 85. Footwear | 1 | 0.0 | 1 | 0.0 | 3 | 0.0 | ||||
| 87. Instruments and apparates n.e.s. | 81 | 0.2 | 27 | 0.1 | 86 | 0.5 | 197 | 0.9 | 283 | 0.8 |
| 89. Miscellaneous manufactured articles,n.e.s. | 207 | 0.5 | 267 | 0.5 | 123 | 0.7 | 268 | 1.2 | 222 | 0.7 |
| All groups combined | 42,138 | 100.0 | 51,816 | 100.0 | 17,576 | 100.0 | 21,617 | 100.0 | 34,013 | 100.0 |
| Classification | Description | Year level | Quarter level | Month level | |
|---|---|---|---|---|---|
| SITC | Standard International Trade Classification (classification system is maintained by the United Nations) | ███ | ███ | ███ | |
| BEC | The standard of statistical classification of BEC (Broad Economic Categories) is upheld by the UN and it is based on SITC-nomenclature. | ███ | ███ | ███ | |
| NACE | National industrial classification based on Statistical Classification of Economic Activities in the European Community Nomenclature générale des Activités économiques dans les Communautés européennes | ███ | ███ | ███ | |
| CPA | CPA = Classification of Products by Activities | ███ | ███ | ███ | |
| CN | The Combined Nomenclature is the common nomenclature of the European Community. | ███ | ███ | ███ |