
| Export of goods from Finland and import to Finland | BEC (Broad Economic Categories) |
*) The standard of statistical classification of BEC (Broad Economic Categories) is upheld by the UN and it is based on SITC-nomenclature.

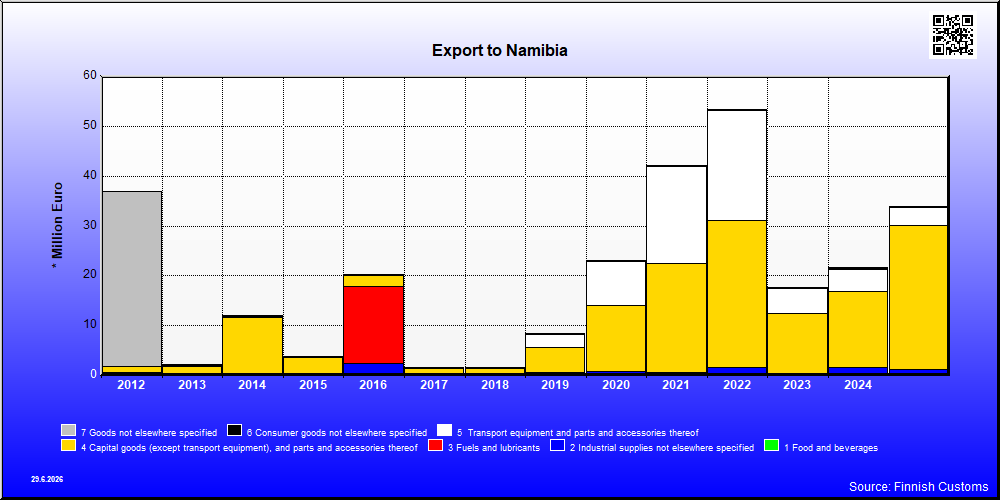
| 2021 | 2022 | 2023 | 2024 | 2025 | ||||||
|---|---|---|---|---|---|---|---|---|---|---|
| 1,000 € | % | 1,000 € | % | 1,000 € | % | 1,000 € | % | 1,000 € | % | |
| 2. Industrial supplies not elsewhere specified | 574 | 1.4 | 1,528 | 2.9 | 492 | 2.8 | 1,688 | 7.8 | 1,163 | 3.4 |
| 21. Industrial supplies not elsewhere specified, primary | 2 | 0.0 | ||||||||
| 22. Industrial supplies not elsewhere specified, processed | 574 | 1.4 | 1,526 | 2.9 | 492 | 2.8 | 1,688 | 7.8 | 1,163 | 3.4 |
| 3. Fuels and lubricants | 2 | 0.0 | ||||||||
| 32. Fuels and lubricants, processed | 2 | 0.0 | ||||||||
| 322. Fuels and lubricants, other | 2 | 0.0 | ||||||||
| 4. Capital goods (except transport equipment), and parts and accessories thereof | 21,885 | 51.9 | 29,512 | 55.3 | 11,934 | 67.9 | 15,131 | 70.0 | 28,857 | 84.8 |
| 41. Capital goods (except transport equipment) | 21,579 | 51.2 | 28,850 | 54.0 | 11,506 | 65.5 | 13,755 | 63.6 | 27,838 | 81.8 |
| 42. Capital goods (except transport equipment), parts and accessories | 306 | 0.7 | 661 | 1.2 | 429 | 2.4 | 1,376 | 6.4 | 1,019 | 3.0 |
| 5. Transport equipment and parts and accessories thereof | 19,399 | 46.0 | 22,102 | 41.4 | 5,009 | 28.5 | 4,539 | 21.0 | 3,676 | 10.8 |
| 52. Transport equipment, other than passenger motor vehicles | 19,399 | 46.0 | 22,102 | 41.4 | 5,007 | 28.5 | 4,536 | 21.0 | 3,671 | 10.8 |
| 521. Transport equipment, other than passenger motor vehicles, industrial | 19,399 | 46.0 | 22,102 | 41.4 | 5,007 | 28.5 | 4,536 | 21.0 | 3,671 | 10.8 |
| 53. Transport equipment, parts and accessories | 2 | 0.0 | 3 | 0.0 | 5 | 0.0 | ||||
| 6. Consumer goods not elsewhere specified | 265 | 0.6 | 204 | 0.4 | 112 | 0.6 | 213 | 1.0 | 261 | 0.8 |
| 61. Consumer goods not elsewhere specified, durable | 144 | 0.3 | 134 | 0.3 | 93 | 0.5 | 148 | 0.7 | 131 | 0.4 |
| 62. Consumer goods not elsewhere specified, semi-durable | 61 | 0.1 | 66 | 0.1 | 7 | 0.0 | 61 | 0.3 | 22 | 0.1 |
| 63. Consumer goods not elsewhere specified, non-durable | 61 | 0.1 | 4 | 0.0 | 12 | 0.1 | 5 | 0.0 | 109 | 0.3 |
| 7. Goods not elsewhere specified | 15 | 0.0 | 55 | 0.1 | 26 | 0.1 | 45 | 0.2 | 56 | 0.2 |
| All groups | 42,138 | 100.0 | 53,401 | 100.0 | 17,576 | 100.0 | 21,617 | 100.0 | 34,013 | 100.0 |
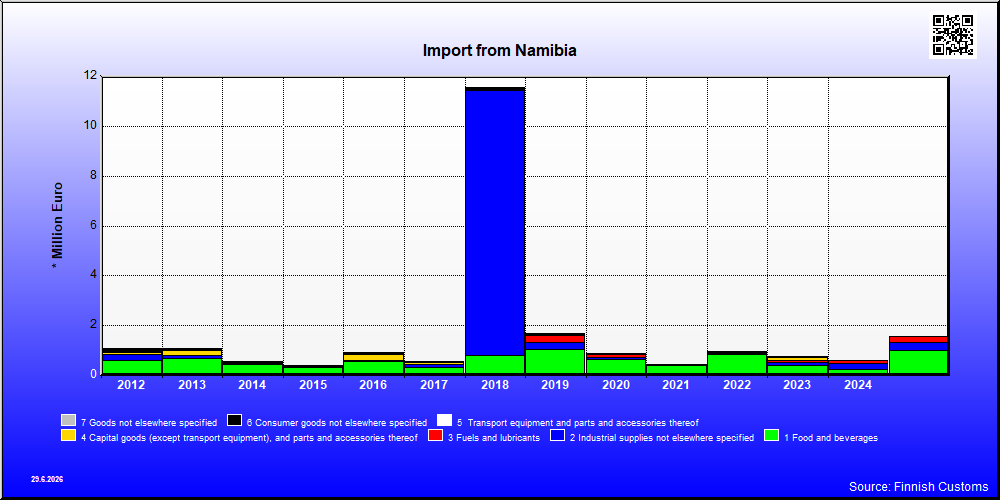
| 2021 | 2022 | 2023 | 2024 | 2025 | ||||||
|---|---|---|---|---|---|---|---|---|---|---|
| 1,000 € | % | 1,000 € | % | 1,000 € | % | 1,000 € | % | 1,000 € | % | |
| 1. Food and beverages | 418 | 91.7 | 844 | 89.6 | 403 | 54.6 | 223 | 37.1 | 991 | 63.2 |
| 11. Food and beverages, primary | 416 | 91.3 | 820 | 87.0 | 393 | 53.2 | 222 | 36.9 | 855 | 54.6 |
| 112. Food and beverages, primary, mainly for household consumption | 416 | 91.3 | 820 | 87.0 | 393 | 53.2 | 222 | 36.9 | 855 | 54.6 |
| 12. Food and beverages, processed | 2 | 0.4 | 24 | 2.5 | 11 | 1.4 | 1 | 0.2 | 136 | 8.6 |
| 121. Food and beverages, processed, mainly for industry | 10 | 1.0 | ||||||||
| 122. Food and beverages, processed, mainly for household consumption | 2 | 0.4 | 14 | 1.5 | 11 | 1.4 | 1 | 0.2 | 136 | 8.6 |
| 2. Industrial supplies not elsewhere specified | 20 | 4.5 | 18 | 1.9 | 132 | 17.9 | 252 | 41.9 | 335 | 21.4 |
| 21. Industrial supplies not elsewhere specified, primary | 130 | 17.6 | 192 | 31.9 | 322 | 20.5 | ||||
| 22. Industrial supplies not elsewhere specified, processed | 20 | 4.5 | 18 | 1.9 | 2 | 0.3 | 60 | 10.0 | 13 | 0.8 |
| 3. Fuels and lubricants | 86 | 11.7 | 117 | 19.5 | 225 | 14.3 | ||||
| 32. Fuels and lubricants, processed | 86 | 11.7 | 117 | 19.5 | 225 | 14.3 | ||||
| 322. Fuels and lubricants, other | 86 | 11.7 | 117 | 19.5 | 225 | 14.3 | ||||
| 4. Capital goods (except transport equipment), and parts and accessories thereof | 2 | 0.5 | 21 | 2.2 | 108 | 14.6 | 2 | 0.3 | 3 | 0.2 |
| 41. Capital goods (except transport equipment) | 1 | 0.3 | 21 | 2.2 | 108 | 14.6 | 2 | 0.3 | 3 | 0.2 |
| 42. Capital goods (except transport equipment), parts and accessories | 1 | 0.2 | ||||||||
| 5. Transport equipment and parts and accessories thereof | 49 | 5.2 | 5 | 0.7 | ||||||
| 52. Transport equipment, other than passenger motor vehicles | 37 | 3.9 | 5 | 0.7 | ||||||
| 522. Transport equipment, other than passenger motor vehicles, non-industrial | 37 | 3.9 | 5 | 0.7 | ||||||
| 53. Transport equipment, parts and accessories | 12 | 1.3 | ||||||||
| 6. Consumer goods not elsewhere specified | 15 | 3.3 | 2 | 0.2 | 8 | 1.1 | 7 | 1.1 | 13 | 0.8 |
| 61. Consumer goods not elsewhere specified, durable | 12 | 2.7 | 5 | 0.7 | 5 | 0.8 | 3 | 0.2 | ||
| 62. Consumer goods not elsewhere specified, semi-durable | 2 | 0.5 | 1 | 0.1 | 1 | 0.2 | 1 | 0.2 | 10 | 0.6 |
| 63. Consumer goods not elsewhere specified, non-durable | 2 | 0.2 | ||||||||
| 7. Goods not elsewhere specified | 1 | 0.3 | 11 | 1.1 | 1 | 0.1 | ||||
| All groups | 456 | 100.0 | 943 | 100.0 | 739 | 100.0 | 602 | 100.0 | 1,567 | 100.0 |
| Classification | Description | Year level | Quarter level | Month level | |
|---|---|---|---|---|---|
| SITC | Standard International Trade Classification (classification system is maintained by the United Nations) | ███ | ███ | ||
| BEC | The standard of statistical classification of BEC (Broad Economic Categories) is upheld by the UN and it is based on SITC-nomenclature. | ███ | ███ | ||
| NACE | National industrial classification based on Statistical Classification of Economic Activities in the European Community Nomenclature générale des Activités économiques dans les Communautés européennes | ███ | ███ | ||
| CPA | CPA = Classification of Products by Activities | ███ | ███ | ||
| CN | The Combined Nomenclature is the common nomenclature of the European Community. | ███ | ███ |