
| Export of goods from Finland and import to Finland | Trade Balance |

| Year | Import 1,000 € | Export 1,000 € | Trade 1,000 € | Trade balance 1,000 € |
|---|---|---|---|---|
| 2002 | 67,109 | 267,448 | 334,557 | 200,339 |
| 2003 | 78,715 | 262,812 | 341,527 | 184,098 |
| 2004 | 66,309 | 265,905 | 332,214 | 199,596 |
| 2005 | 92,851 | 311,074 | 403,924 | 218,223 |
| 2006 | 94,754 | 370,621 | 465,374 | 275,867 |
| 2007 | 146,216 | 412,416 | 558,632 | 266,201 |
| 2008 | 199,868 | 380,808 | 580,676 | 180,940 |
| 2009 | 199,334 | 189,114 | 388,447 | -10,220 |
| 2010 | 230,087 | 218,987 | 449,074 | -11,100 |
| 2011 | 283,904 | 342,993 | 626,897 | 59,089 |
| 2012 | 277,435 | 325,603 | 603,037 | 48,168 |
| 2013 | 336,258 | 359,544 | 695,803 | 23,286 |
| 2014 | 319,987 | 378,882 | 698,869 | 58,896 |
| 2015 | 351,849 | 386,754 | 738,603 | 34,905 |
| 2016 | 374,774 | 395,082 | 769,855 | 20,308 |
| 2017 | 410,444 | 510,401 | 920,845 | 99,957 |
| 2018 | 475,412 | 566,585 | 1,041,997 | 91,174 |
| 2019 | 518,536 | 593,555 | 1,112,091 | 75,018 |
| 2020 | 551,450 | 566,494 | 1,117,944 | 15,044 |
| 2021 | 594,089 | 780,156 | 1,374,244 | 186,067 |
| 2022 | 745,623 | 959,825 | 1,705,447 | 214,202 |
| 2023 | 694,033 | 832,204 | 1,526,237 | 138,172 |
| 2024 | 706,882 | 768,961 | 1,475,843 | 62,079 |
| 2025 | 657,999 | 851,725 | 1,509,723 | 193,726 |
*) SITC = Standard International Trade Classification (classification system is maintained by the United Nations)


| 2021 | 2022 | 2023 | 2024 | 2025 | ||||||
|---|---|---|---|---|---|---|---|---|---|---|
| 1,000 € | % | 1,000 € | % | 1,000 € | % | 1,000 € | % | 1,000 € | % | |
| 0. Food and live animals | 41,122 | 5.3 | 69,231 | 7.2 | 59,966 | 7.1 | 62,225 | 8.1 | 65,070 | 7.6 |
| 01. Meat and meat preparations | 1,041 | 0.1 | 4,483 | 0.5 | 3,690 | 0.4 | 3,327 | 0.4 | 2,428 | 0.3 |
| 02. Dairy products and birds' eggs | 1,005 | 0.1 | 2,510 | 0.3 | 2,600 | 0.3 | 1,062 | 0.1 | 2,708 | 0.3 |
| 03. Fish and fish preparations | 20,200 | 2.6 | 31,428 | 3.2 | 19,870 | 2.4 | 24,684 | 3.2 | 14,939 | 1.8 |
| 04. Cereals and cereal preparations | 1,561 | 0.2 | 3,388 | 0.4 | 6,702 | 0.8 | 4,805 | 0.6 | 4,983 | 0.6 |
| 05. Vegetables and fruit | 1,114 | 0.1 | 1,051 | 0.1 | 1,124 | 0.1 | 1,559 | 0.2 | 5,868 | 0.7 |
| 06. Sugars,sugar preparations and honey | 1,565 | 0.2 | 1,121 | 0.1 | 2,127 | 0.3 | 2,076 | 0.3 | 1,848 | 0.2 |
| 07. Coffee,tea,cocoa,spices | 10,389 | 1.3 | 18,456 | 1.9 | 16,500 | 2.0 | 19,051 | 2.5 | 24,680 | 2.9 |
| 08. Feeding stuff for animals | 1,438 | 0.2 | 2,587 | 0.3 | 2,806 | 0.3 | 1,770 | 0.2 | 1,328 | 0.2 |
| 09. Miscellaneous edible products and preparations | 2,809 | 0.4 | 4,207 | 0.4 | 4,546 | 0.5 | 3,892 | 0.5 | 6,286 | 0.7 |
| 1. Beverages and tobacco | 4,900 | 0.6 | 7,008 | 0.7 | 6,732 | 0.8 | 8,450 | 1.1 | 8,406 | 1.0 |
| 11. Beverages | 4,900 | 0.6 | 7,008 | 0.7 | 6,732 | 0.8 | 8,450 | 1.1 | 8,406 | 1.0 |
| 2. Crude materials,inedible,except fuels | 61,494 | 7.9 | 74,196 | 7.7 | 62,629 | 7.4 | 61,175 | 8.0 | 71,966 | 8.5 |
| 21. Hides,skins,furskins,raw | 1,865 | 0.2 | 4,354 | 0.4 | 2,870 | 0.3 | 2,237 | 0.3 | 4,838 | 0.6 |
| 22. Oil seeds,oleaginous fruits | 28 | 0.0 | 10 | 0.0 | 10 | 0.0 | 13 | 0.0 | 13 | 0.0 |
| 23. Crude rubber (incl.synthetic) | 21 | 0.0 | 3 | 0.0 | 5 | 0.0 | 9 | 0.0 | 3 | 0.0 |
| 24. Cork and wood | 14,402 | 1.8 | 24,635 | 2.5 | 26,921 | 3.2 | 28,516 | 3.7 | 37,676 | 4.4 |
| 25. Pulp and waste paper | 12,786 | 1.6 | 11,102 | 1.1 | 7,635 | 0.9 | 8,460 | 1.1 | 8,130 | 1.0 |
| 26. Textile fibres and their wastes | 829 | 0.1 | 900 | 0.1 | 1,903 | 0.2 | 3,262 | 0.4 | 4,287 | 0.5 |
| 27. Crude fertilizers and crude minerals | 2,427 | 0.3 | 2,542 | 0.3 | 3,005 | 0.4 | 4,077 | 0.5 | 3,668 | 0.4 |
| 28. Metalliferous ores and metal scrap | 28,805 | 3.7 | 29,351 | 3.0 | 17,689 | 2.1 | 12,633 | 1.7 | 11,919 | 1.4 |
| 29. Crude animal,vegetable materials n.e.s. | 331 | 0.0 | 1,298 | 0.1 | 2,592 | 0.3 | 1,966 | 0.3 | 1,433 | 0.2 |
| 3. Mineral fuels etc | 132,546 | 17.0 | 188,657 | 19.5 | 153,425 | 18.2 | 103,344 | 13.5 | 165,291 | 19.4 |
| 32. Coal,coke and briquettes | 28 | 0.0 | 13 | 0.0 | 20 | 0.0 | 8 | 0.0 | ||
| 33. Petroleum and products | 132,493 | 17.0 | 188,606 | 19.5 | 153,383 | 18.2 | 103,330 | 13.5 | 165,288 | 19.4 |
| 34. Gas,natural and manufactured | 25 | 0.0 | 38 | 0.0 | 22 | 0.0 | 6 | 0.0 | 2 | 0.0 |
| 4. Animal and vegetable oils and fats | 1,712 | 0.2 | 410 | 0.0 | 473 | 0.1 | 595 | 0.1 | 759 | 0.1 |
| 41. Animal oils and fats | 93 | 0.0 | 111 | 0.0 | 56 | 0.0 | 176 | 0.0 | 58 | 0.0 |
| 42. Fixed vegetable fats and oils | 1,606 | 0.2 | 299 | 0.0 | 415 | 0.0 | 426 | 0.1 | 658 | 0.1 |
| 43. Processed animal or vegetable oils,etc. | 13 | 0.0 | 2 | 0.0 | 2 | 0.0 | 43 | 0.0 | ||
| 5. Chemicals and related products,n.e.s. | 123,465 | 15.8 | 155,949 | 16.1 | 113,229 | 13.4 | 99,209 | 13.0 | 100,680 | 11.8 |
| 51. Organic chemicals | 10,826 | 1.4 | 11,791 | 1.2 | 15,468 | 1.8 | 8,736 | 1.1 | 16,527 | 1.9 |
| 52. Inorganic chemicals | 420 | 0.1 | 697 | 0.1 | 1,275 | 0.2 | 2,308 | 0.3 | 1,224 | 0.1 |
| 53. Dyeing,tanning and colouring material | 8,469 | 1.1 | 9,289 | 1.0 | 9,088 | 1.1 | 7,194 | 0.9 | 5,225 | 0.6 |
| 54. Medicinal and pharmaceutical products | 3,751 | 0.5 | 4,609 | 0.5 | 7,364 | 0.9 | 11,369 | 1.5 | 10,318 | 1.2 |
| 55. Perfume,cleaning etc.preparations | 2,183 | 0.3 | 2,924 | 0.3 | 5,909 | 0.7 | 4,463 | 0.6 | 6,177 | 0.7 |
| 56. Fertilizers,manufactured | 68,025 | 8.7 | 75,800 | 7.8 | 20,769 | 2.5 | 24,600 | 3.2 | 15,195 | 1.8 |
| 57. Plastics in primary forms | 12,297 | 1.6 | 23,793 | 2.5 | 17,054 | 2.0 | 17,900 | 2.3 | 19,812 | 2.3 |
| 58. Plastics in non-primary forms | 9,459 | 1.2 | 11,994 | 1.2 | 13,973 | 1.7 | 12,221 | 1.6 | 14,381 | 1.7 |
| 59. Chemical materials and products,n.e.s. | 8,034 | 1.0 | 15,052 | 1.6 | 22,328 | 2.6 | 10,418 | 1.4 | 11,821 | 1.4 |
| 6. Basic manufactures | 140,488 | 18.0 | 165,488 | 17.1 | 147,212 | 17.4 | 140,822 | 18.4 | 136,379 | 16.0 |
| 61. Leather,dressed fur,etc. | 67 | 0.0 | 36 | 0.0 | 26 | 0.0 | 11 | 0.0 | 43 | 0.0 |
| 62. Rubber manufactures,n.e.s. | 3,731 | 0.5 | 4,514 | 0.5 | 4,028 | 0.5 | 4,513 | 0.6 | 5,193 | 0.6 |
| 63. Wood and cork manufactures | 6,467 | 0.8 | 6,302 | 0.7 | 4,847 | 0.6 | 5,191 | 0.7 | 5,239 | 0.6 |
| 64. Paper,paperboard and articles thereof | 49,271 | 6.3 | 67,796 | 7.0 | 50,215 | 6.0 | 52,633 | 6.9 | 44,955 | 5.3 |
| 65. Textile yarn,fabrics,made up articles,etc. | 6,431 | 0.8 | 6,620 | 0.7 | 6,537 | 0.8 | 5,956 | 0.8 | 6,434 | 0.8 |
| 66. Non-metallic mineral manufactures,n.e.s. | 12,240 | 1.6 | 14,864 | 1.5 | 16,171 | 1.9 | 12,149 | 1.6 | 12,142 | 1.4 |
| 67. Iron and steel | 29,055 | 3.7 | 30,885 | 3.2 | 30,613 | 3.6 | 31,045 | 4.1 | 30,756 | 3.6 |
| 68. Non-ferrous metals | 2,204 | 0.3 | 5,006 | 0.5 | 2,790 | 0.3 | 2,018 | 0.3 | 2,342 | 0.3 |
| 69. Manufactures of metals,n.e.s. | 31,023 | 4.0 | 29,465 | 3.0 | 31,984 | 3.8 | 27,306 | 3.6 | 29,275 | 3.4 |
| 7. Machinery,transport equipment | 208,496 | 26.7 | 250,500 | 25.9 | 263,089 | 31.2 | 252,357 | 33.0 | 268,277 | 31.5 |
| 71. Power generating machinery and equipment | 4,191 | 0.5 | 7,088 | 0.7 | 12,975 | 1.5 | 5,350 | 0.7 | 6,575 | 0.8 |
| 72. Machinery for specialized industries | 55,667 | 7.1 | 40,896 | 4.2 | 39,620 | 4.7 | 50,845 | 6.7 | 40,697 | 4.8 |
| 73. Metal working machinery | 1,284 | 0.2 | 3,169 | 0.3 | 2,228 | 0.3 | 4,023 | 0.5 | 3,445 | 0.4 |
| 74. General industrial machinery n.e.s. | 20,511 | 2.6 | 26,560 | 2.7 | 25,091 | 3.0 | 21,613 | 2.8 | 27,264 | 3.2 |
| 75. Office machines and adp machines | 5,794 | 0.7 | 7,460 | 0.8 | 14,379 | 1.7 | 10,216 | 1.3 | 6,212 | 0.7 |
| 76. Telecommunications and sound recording equipment | 12,906 | 1.7 | 20,609 | 2.1 | 27,286 | 3.2 | 22,364 | 2.9 | 12,228 | 1.4 |
| 77. Electric machinery,n.e.s.and parts | 41,139 | 5.3 | 49,730 | 5.1 | 42,025 | 5.0 | 28,924 | 3.8 | 32,558 | 3.8 |
| 78. Road vehicles | 64,358 | 8.3 | 90,964 | 9.4 | 99,017 | 11.7 | 107,901 | 14.1 | 136,318 | 16.0 |
| 79. Other transport equipment | 2,646 | 0.3 | 4,023 | 0.4 | 469 | 0.1 | 1,121 | 0.1 | 2,981 | 0.4 |
| 8. Miscellaneous manufactured articles | 25,374 | 3.3 | 30,909 | 3.2 | 36,489 | 4.3 | 34,608 | 4.5 | 33,472 | 3.9 |
| 81. Prefabr.buildings;sanitary,lighting etc.fixtrs | 1,228 | 0.2 | 1,647 | 0.2 | 1,701 | 0.2 | 1,868 | 0.2 | 2,123 | 0.2 |
| 82. Furniture and parts thereof | 2,860 | 0.4 | 3,206 | 0.3 | 3,210 | 0.4 | 2,358 | 0.3 | 2,145 | 0.3 |
| 83. Travel goods,handbags and sim.containers | 140 | 0.0 | 234 | 0.0 | 448 | 0.1 | 312 | 0.0 | 267 | 0.0 |
| 84. Articles of apparel and clothing accessories | 3,721 | 0.5 | 4,829 | 0.5 | 5,449 | 0.6 | 4,609 | 0.6 | 3,445 | 0.4 |
| 85. Footwear | 565 | 0.1 | 791 | 0.1 | 649 | 0.1 | 876 | 0.1 | 1,029 | 0.1 |
| 87. Instruments and apparates n.e.s. | 6,890 | 0.9 | 7,975 | 0.8 | 8,184 | 1.0 | 7,692 | 1.0 | 8,665 | 1.0 |
| 88. Photographic equipment,optical goods etc. | 271 | 0.0 | 762 | 0.1 | 1,328 | 0.2 | 689 | 0.1 | 432 | 0.1 |
| 89. Miscellaneous manufactured articles,n.e.s. | 9,698 | 1.2 | 11,464 | 1.2 | 15,519 | 1.8 | 16,204 | 2.1 | 15,364 | 1.8 |
| 9. Goods not classified elsewhere | 40,051 | 5.1 | 25,475 | 2.6 | 432 | 0.1 | 784 | 0.1 | 569 | 0.1 |
| 93. Special transactions and commodities not classified | 40,051 | 5.1 | 25,475 | 2.6 | 432 | 0.1 | 784 | 0.1 | 569 | 0.1 |
| All groups combined | 779,648 | 100.0 | 967,823 | 100.0 | 843,676 | 100.0 | 763,569 | 100.0 | 850,869 | 100.0 |
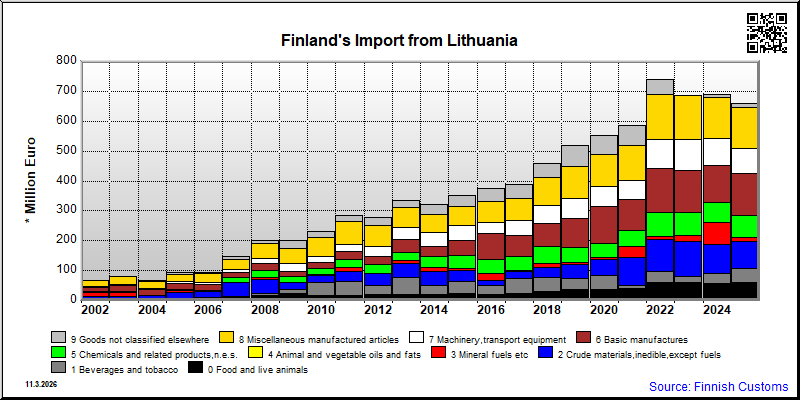
| 2021 | 2022 | 2023 | 2024 | 2025 | ||||||
|---|---|---|---|---|---|---|---|---|---|---|
| 1,000 € | % | 1,000 € | % | 1,000 € | % | 1,000 € | % | 1,000 € | % | |
| 0. Food and live animals | 39,599 | 6.8 | 59,442 | 8.0 | 59,894 | 8.7 | 56,309 | 8.2 | 60,570 | 9.2 |
| 01. Meat and meat preparations | 7,415 | 1.3 | 7,993 | 1.1 | 6,755 | 1.0 | 7,350 | 1.1 | 8,155 | 1.2 |
| 02. Dairy products and birds' eggs | 3,559 | 0.6 | 3,328 | 0.4 | 3,506 | 0.5 | 4,085 | 0.6 | 4,298 | 0.7 |
| 03. Fish and fish preparations | 3,046 | 0.5 | 2,879 | 0.4 | 3,285 | 0.5 | 3,162 | 0.5 | 2,770 | 0.4 |
| 04. Cereals and cereal preparations | 6,237 | 1.1 | 13,156 | 1.8 | 10,839 | 1.6 | 9,626 | 1.4 | 9,132 | 1.4 |
| 05. Vegetables and fruit | 7,112 | 1.2 | 4,968 | 0.7 | 5,598 | 0.8 | 8,616 | 1.3 | 9,300 | 1.4 |
| 06. Sugars,sugar preparations and honey | 2,958 | 0.5 | 8,162 | 1.1 | 12,989 | 1.9 | 8,639 | 1.3 | 8,520 | 1.3 |
| 07. Coffee,tea,cocoa,spices | 3,542 | 0.6 | 277 | 0.0 | 377 | 0.1 | 651 | 0.1 | 705 | 0.1 |
| 08. Feeding stuff for animals | 3,655 | 0.6 | 14,325 | 1.9 | 10,748 | 1.6 | 7,046 | 1.0 | 9,305 | 1.4 |
| 09. Miscellaneous edible products and preparations | 2,075 | 0.4 | 4,355 | 0.6 | 5,798 | 0.8 | 7,134 | 1.0 | 8,385 | 1.3 |
| 1. Beverages and tobacco | 10,781 | 1.8 | 37,390 | 5.1 | 21,549 | 3.1 | 35,701 | 5.2 | 45,403 | 6.9 |
| 11. Beverages | 400 | 0.1 | 813 | 0.1 | 1,278 | 0.2 | 1,534 | 0.2 | 769 | 0.1 |
| 12. Tobacco and tobacco manufactures | 10,381 | 1.8 | 36,577 | 4.9 | 20,271 | 2.9 | 34,167 | 5.0 | 44,634 | 6.8 |
| 2. Crude materials,inedible,except fuels | 94,835 | 16.2 | 107,194 | 14.5 | 115,907 | 16.9 | 95,200 | 13.8 | 92,081 | 14.0 |
| 21. Hides,skins,furskins,raw | 31,893 | 5.5 | 38,979 | 5.3 | 34,827 | 5.1 | 19,181 | 2.8 | 13,171 | 2.0 |
| 22. Oil seeds,oleaginous fruits | 12,581 | 2.2 | 19,266 | 2.6 | 21,605 | 3.1 | 19,328 | 2.8 | 38,252 | 5.8 |
| 23. Crude rubber (incl.synthetic) | 11 | 0.0 | ||||||||
| 24. Cork and wood | 6,404 | 1.1 | 16,215 | 2.2 | 27,629 | 4.0 | 21,450 | 3.1 | 19,501 | 3.0 |
| 25. Pulp and waste paper | 45 | 0.0 | 642 | 0.1 | 162 | 0.0 | 3 | 0.0 | 12 | 0.0 |
| 26. Textile fibres and their wastes | 1 | 0.0 | 103 | 0.0 | 215 | 0.0 | 253 | 0.0 | ||
| 27. Crude fertilizers and crude minerals | 17 | 0.0 | 50 | 0.0 | 246 | 0.0 | 323 | 0.0 | 457 | 0.1 |
| 28. Metalliferous ores and metal scrap | 43,111 | 7.4 | 31,568 | 4.3 | 30,919 | 4.5 | 34,195 | 5.0 | 19,677 | 3.0 |
| 29. Crude animal,vegetable materials n.e.s. | 783 | 0.1 | 473 | 0.1 | 415 | 0.1 | 495 | 0.1 | 759 | 0.1 |
| 3. Mineral fuels etc | 35,550 | 6.1 | 11,187 | 1.5 | 18,889 | 2.7 | 73,241 | 10.6 | 11,260 | 1.7 |
| 32. Coal,coke and briquettes | 93 | 0.0 | ||||||||
| 33. Petroleum and products | 7,435 | 1.3 | 4,991 | 0.7 | 10,928 | 1.6 | 40,849 | 5.9 | 11,260 | 1.7 |
| 34. Gas,natural and manufactured | 28,115 | 4.8 | 6,196 | 0.8 | 7,868 | 1.1 | 32,392 | 4.7 | ||
| 4. Animal and vegetable oils and fats | 166 | 0.0 | 292 | 0.0 | 237 | 0.0 | 247 | 0.0 | 622 | 0.1 |
| 41. Animal oils and fats | 27 | 0.0 | 56 | 0.0 | 12 | 0.0 | ||||
| 42. Fixed vegetable fats and oils | 139 | 0.0 | 236 | 0.0 | 225 | 0.0 | 247 | 0.0 | 622 | 0.1 |
| 5. Chemicals and related products,n.e.s. | 53,801 | 9.2 | 78,947 | 10.7 | 78,490 | 11.4 | 67,177 | 9.8 | 76,052 | 11.6 |
| 51. Organic chemicals | 2,792 | 0.5 | 4,162 | 0.6 | 2,677 | 0.4 | 4,616 | 0.7 | 3,755 | 0.6 |
| 52. Inorganic chemicals | 1,365 | 0.2 | 1,212 | 0.2 | 1,009 | 0.1 | 837 | 0.1 | 967 | 0.1 |
| 53. Dyeing,tanning and colouring material | 638 | 0.1 | 861 | 0.1 | 808 | 0.1 | 687 | 0.1 | 982 | 0.1 |
| 54. Medicinal and pharmaceutical products | 93 | 0.0 | 425 | 0.1 | 234 | 0.0 | 914 | 0.1 | 1,862 | 0.3 |
| 55. Perfume,cleaning etc.preparations | 1,083 | 0.2 | 1,502 | 0.2 | 1,164 | 0.2 | 1,385 | 0.2 | 1,634 | 0.2 |
| 56. Fertilizers,manufactured | 1,229 | 0.2 | 14,252 | 1.9 | 13,063 | 1.9 | 7,743 | 1.1 | 11,077 | 1.7 |
| 57. Plastics in primary forms | 8,473 | 1.5 | 10,632 | 1.4 | 8,516 | 1.2 | 9,972 | 1.4 | 10,862 | 1.7 |
| 58. Plastics in non-primary forms | 12,379 | 2.1 | 16,913 | 2.3 | 14,798 | 2.2 | 13,657 | 2.0 | 14,327 | 2.2 |
| 59. Chemical materials and products,n.e.s. | 25,750 | 4.4 | 28,987 | 3.9 | 36,221 | 5.3 | 27,365 | 4.0 | 30,587 | 4.6 |
| 6. Basic manufactures | 103,097 | 17.6 | 146,625 | 19.8 | 139,950 | 20.3 | 122,878 | 17.9 | 138,697 | 21.1 |
| 61. Leather,dressed fur,etc. | 1 | 0.0 | 2 | 0.0 | 2 | 0.0 | ||||
| 62. Rubber manufactures,n.e.s. | 1,650 | 0.3 | 1,428 | 0.2 | 1,719 | 0.2 | 1,912 | 0.3 | 2,381 | 0.4 |
| 63. Wood and cork manufactures | 6,224 | 1.1 | 9,296 | 1.3 | 8,465 | 1.2 | 7,448 | 1.1 | 9,650 | 1.5 |
| 64. Paper,paperboard and articles thereof | 9,535 | 1.6 | 14,460 | 2.0 | 19,834 | 2.9 | 23,724 | 3.4 | 24,259 | 3.7 |
| 65. Textile yarn,fabrics,made up articles,etc. | 7,385 | 1.3 | 9,843 | 1.3 | 10,063 | 1.5 | 8,385 | 1.2 | 9,393 | 1.4 |
| 66. Non-metallic mineral manufactures,n.e.s. | 10,736 | 1.8 | 11,786 | 1.6 | 21,335 | 3.1 | 20,284 | 2.9 | 18,913 | 2.9 |
| 67. Iron and steel | 16,142 | 2.8 | 37,421 | 5.1 | 27,661 | 4.0 | 18,942 | 2.8 | 16,860 | 2.6 |
| 68. Non-ferrous metals | 328 | 0.1 | 419 | 0.1 | 802 | 0.1 | 1,401 | 0.2 | 794 | 0.1 |
| 69. Manufactures of metals,n.e.s. | 51,097 | 8.7 | 61,973 | 8.4 | 50,070 | 7.3 | 40,780 | 5.9 | 56,446 | 8.6 |
| 7. Machinery,transport equipment | 64,378 | 11.0 | 98,148 | 13.3 | 104,795 | 15.2 | 90,679 | 13.2 | 85,173 | 12.9 |
| 71. Power generating machinery and equipment | 544 | 0.1 | 979 | 0.1 | 2,160 | 0.3 | 2,404 | 0.3 | 1,463 | 0.2 |
| 72. Machinery for specialized industries | 7,962 | 1.4 | 16,259 | 2.2 | 16,876 | 2.5 | 12,141 | 1.8 | 11,625 | 1.8 |
| 73. Metal working machinery | 36 | 0.0 | 12 | 0.0 | 44 | 0.0 | 27 | 0.0 | 17 | 0.0 |
| 74. General industrial machinery n.e.s. | 13,662 | 2.3 | 20,850 | 2.8 | 20,466 | 3.0 | 24,000 | 3.5 | 22,222 | 3.4 |
| 75. Office machines and adp machines | 399 | 0.1 | 1,082 | 0.1 | 458 | 0.1 | 357 | 0.1 | 359 | 0.1 |
| 76. Telecommunications and sound recording equipment | 12,725 | 2.2 | 18,975 | 2.6 | 25,070 | 3.6 | 12,374 | 1.8 | 9,746 | 1.5 |
| 77. Electric machinery,n.e.s.and parts | 20,858 | 3.6 | 27,886 | 3.8 | 27,103 | 3.9 | 26,180 | 3.8 | 30,902 | 4.7 |
| 78. Road vehicles | 7,497 | 1.3 | 11,066 | 1.5 | 11,369 | 1.7 | 12,284 | 1.8 | 7,950 | 1.2 |
| 79. Other transport equipment | 696 | 0.1 | 1,039 | 0.1 | 1,249 | 0.2 | 912 | 0.1 | 888 | 0.1 |
| 8. Miscellaneous manufactured articles | 116,389 | 19.9 | 151,778 | 20.5 | 146,476 | 21.3 | 137,390 | 20.0 | 136,736 | 20.8 |
| 81. Prefabr.buildings;sanitary,lighting etc.fixtrs | 6,792 | 1.2 | 13,524 | 1.8 | 7,666 | 1.1 | 6,028 | 0.9 | 4,165 | 0.6 |
| 82. Furniture and parts thereof | 54,504 | 9.3 | 64,256 | 8.7 | 63,002 | 9.2 | 52,762 | 7.7 | 56,857 | 8.6 |
| 83. Travel goods,handbags and sim.containers | 44 | 0.0 | 61 | 0.0 | 820 | 0.1 | 925 | 0.1 | 448 | 0.1 |
| 84. Articles of apparel and clothing accessories | 15,709 | 2.7 | 16,643 | 2.2 | 16,404 | 2.4 | 17,400 | 2.5 | 15,985 | 2.4 |
| 85. Footwear | 28 | 0.0 | 50 | 0.0 | 147 | 0.0 | 611 | 0.1 | 449 | 0.1 |
| 87. Instruments and apparates n.e.s. | 3,267 | 0.6 | 6,097 | 0.8 | 8,582 | 1.2 | 10,205 | 1.5 | 12,371 | 1.9 |
| 88. Photographic equipment,optical goods etc. | 318 | 0.1 | 465 | 0.1 | 890 | 0.1 | 775 | 0.1 | 469 | 0.1 |
| 89. Miscellaneous manufactured articles,n.e.s. | 35,726 | 6.1 | 50,682 | 6.8 | 48,963 | 7.1 | 48,685 | 7.1 | 45,992 | 7.0 |
| 9. Goods not classified elsewhere | 65,610 | 11.2 | 48,897 | 6.6 | 1,608 | 0.2 | 9,219 | 1.3 | 11,335 | 1.7 |
| 93. Special transactions and commodities not classified | 65,610 | 11.2 | 48,897 | 6.6 | 1,608 | 0.2 | 9,219 | 1.3 | 11,335 | 1.7 |
| All groups combined | 584,206 | 100.0 | 739,898 | 100.0 | 687,795 | 100.0 | 688,042 | 100.0 | 657,929 | 100.0 |
| Export | 2021 | 2022 | 2023 | 2024 | 2025 | |||||
|---|---|---|---|---|---|---|---|---|---|---|
| 1000 € | % | 1000 € | % | 1000 € | % | 1000 € | % | 1000 € | % | |
| 1 Sea transport (including car ferry and train ferry transport | 786,281 | 99.0 | 955,114 | 99.1 | 835,225 | 99.0 | 759,208 | 99.0 | 844,682 | 99.0 |
| 2 Rail transport | 0 | 7 | 0.0 | 0 | 0 | 2 | 0.0 | |||
| 3 Road transport (only possible at the border) | 0 | 0.0 | 193 | 0.0 | 0 | 0 | 0 | |||
| 4 Air transport | 6,799 | 0.9 | 7,876 | 0.8 | 7,072 | 0.8 | 5,009 | 0.7 | 5,493 | 0.6 |
| 5 Postal consignments | 1,231 | 0.2 | 1,067 | 0.1 | 1,747 | 0.2 | 2,763 | 0.4 | 2,791 | 0.3 |
| 7 Stationary modes of transport (pipe, cable, electric cable) | 0 | 0 | 0 | 0 | 0 | |||||
| 8 Inland water transport (the Saimaa canal) | 0 | 0 | 0 | 0 | 0 | |||||
| 9 Own propulsion (watercraft and aircraft) | 0 | 0 | 0 | 0 | 0 | |||||
| 0 Unknowen mode of transport | 0 | 0 | 0 | 0 | 0 | |||||
| *0-9 All modes of transport together | 794,312 | 100.0 | 964,250 | 100.0 | 844,044 | 100.0 | 766,981 | 100.0 | 852,968 | 100.0 |
| Import | 2021 | 2022 | 2023 | 2024 | 2025 | |||||
|---|---|---|---|---|---|---|---|---|---|---|
| 1000 € | % | 1000 € | % | 1000 € | % | 1000 € | % | 1000 € | % | |
| 1 Sea transport (including car ferry and train ferry transport | 582,379 | 99.2 | 733,400 | 99.4 | 683,905 | 99.4 | 674,334 | 98.0 | 640,870 | 97.4 |
| 2 Rail transport | 19 | 0.0 | 0 | 0.0 | 7 | 0.0 | 0 | 28 | 0.0 | |
| 3 Road transport (only possible at the border) | 709 | 0.1 | 1,234 | 0.2 | 919 | 0.1 | 1,075 | 0.2 | 687 | 0.1 |
| 4 Air transport | 3,199 | 0.5 | 2,822 | 0.4 | 2,519 | 0.4 | 3,285 | 0.5 | 4,507 | 0.7 |
| 5 Postal consignments | 614 | 0.1 | 614 | 0.1 | 745 | 0.1 | 9,424 | 1.4 | 11,662 | 1.8 |
| 7 Stationary modes of transport (pipe, cable, electric cable) | 0 | 0 | 0 | 0 | 0 | |||||
| 8 Inland water transport (the Saimaa canal) | 0 | 0 | 0 | 0 | 0 | |||||
| 9 Own propulsion (watercraft and aircraft) | 0 | 0 | 0 | 0 | 0 | |||||
| 0 Unknowen mode of transport | 0 | 0 | 0 | 0 | 0 | |||||
| *0-9 All modes of transport together | 586,900 | 100.0 | 738,069 | 100.0 | 688,096 | 100.0 | 688,117 | 100.0 | 657,754 | 100.0 |
| Classification | Description | Year level | Quarter level | Month level | |
|---|---|---|---|---|---|
| SITC | Standard International Trade Classification (classification system is maintained by the United Nations) | ███ | ███ | ███ | |
| BEC | The standard of statistical classification of BEC (Broad Economic Categories) is upheld by the UN and it is based on SITC-nomenclature. | ███ | ███ | ███ | |
| NACE | National industrial classification based on Statistical Classification of Economic Activities in the European Community Nomenclature générale des Activités économiques dans les Communautés européennes | ███ | ███ | ███ | |
| CPA | CPA = Classification of Products by Activities | ███ | ███ | ███ | |
| CN | The Combined Nomenclature is the common nomenclature of the European Community. | ███ | ███ | ███ |