
| Export of goods from Finland and import to Finland | Trade Balance |

| Year | Import 1,000 € | Export 1,000 € | Trade 1,000 € | Trade balance 1,000 € |
|---|---|---|---|---|
| 2002 | 6,438 | 1,791 | 8,228 | -4,647 |
| 2003 | 7,391 | 1,598 | 8,989 | -5,793 |
| 2004 | 6,912 | 2,170 | 9,082 | -4,742 |
| 2005 | 8,533 | 2,071 | 10,603 | -6,462 |
| 2006 | 8,980 | 3,410 | 12,389 | -5,570 |
| 2007 | 9,922 | 2,727 | 12,649 | -7,195 |
| 2008 | 6,948 | 3,058 | 10,006 | -3,891 |
| 2009 | 4,141 | 2,320 | 6,461 | -1,821 |
| 2010 | 5,128 | 4,484 | 9,612 | -644 |
| 2011 | 6,155 | 3,596 | 9,751 | -2,559 |
| 2012 | 7,660 | 3,172 | 10,832 | -4,488 |
| 2013 | 6,646 | 3,746 | 10,392 | -2,900 |
| 2014 | 5,914 | 4,257 | 10,171 | -1,657 |
| 2015 | 5,243 | 4,280 | 9,523 | -963 |
| 2016 | 5,742 | 5,551 | 11,293 | -191 |
| 2017 | 5,633 | 7,271 | 12,905 | 1,638 |
| 2018 | 5,388 | 9,864 | 15,252 | 4,476 |
| 2019 | 3,440 | 7,195 | 10,634 | 3,755 |
| 2020 | 4,165 | 12,483 | 16,648 | 8,318 |
| 2021 | 6,892 | 14,388 | 21,280 | 7,496 |
| 2022 | 9,401 | 17,139 | 26,540 | 7,737 |
| 2023 | 9,225 | 19,937 | 29,162 | 10,712 |
| 2024 | 7,078 | 13,045 | 20,122 | 5,967 |
| 2025 | 7,242 | 18,320 | 25,562 | 11,078 |
*) SITC = Standard International Trade Classification (classification system is maintained by the United Nations)
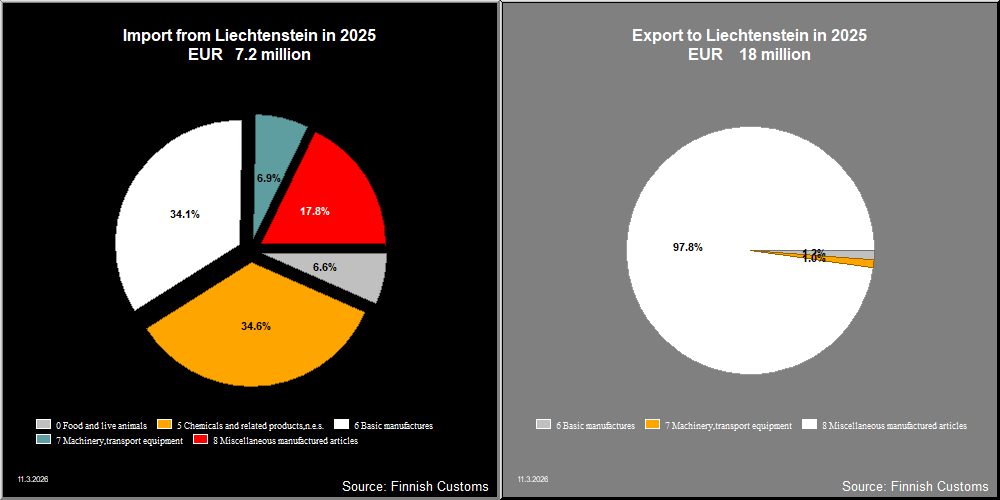
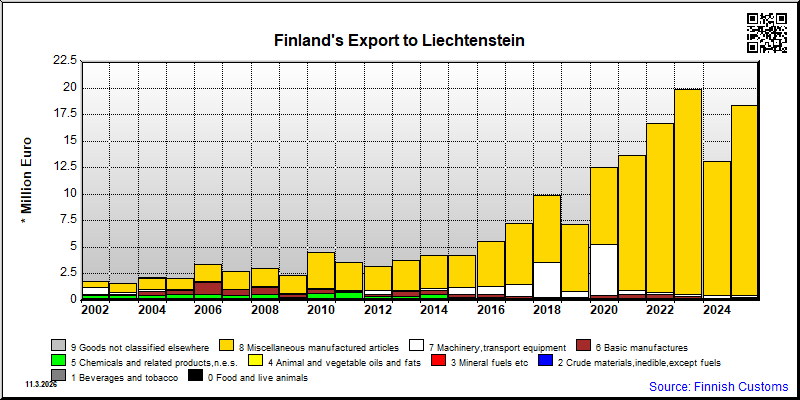
| 2021 | 2022 | 2023 | 2024 | 2025 | ||||||
|---|---|---|---|---|---|---|---|---|---|---|
| 1,000 € | % | 1,000 € | % | 1,000 € | % | 1,000 € | % | 1,000 € | % | |
| 5. Chemicals and related products,n.e.s. | 144 | 1.1 | 80 | 0.5 | 37 | 0.2 | 45 | 0.3 | 46 | 0.3 |
| 51. Organic chemicals | 89 | 0.7 | 2 | 0.0 | 1 | 0.0 | ||||
| 52. Inorganic chemicals | 2 | 0.0 | 1 | 0.0 | 3 | 0.0 | 4 | 0.0 | ||
| 53. Dyeing,tanning and colouring material | 37 | 0.3 | 31 | 0.2 | 11 | 0.1 | 24 | 0.2 | 15 | 0.1 |
| 55. Perfume,cleaning etc.preparations | 2 | 0.0 | ||||||||
| 57. Plastics in primary forms | 9 | 0.1 | 40 | 0.2 | 22 | 0.1 | 14 | 0.1 | 21 | 0.1 |
| 58. Plastics in non-primary forms | 1 | 0.0 | 1 | 0.0 | ||||||
| 59. Chemical materials and products,n.e.s. | 9 | 0.1 | 4 | 0.0 | 2 | 0.0 | 2 | 0.0 | 5 | 0.0 |
| 6. Basic manufactures | 376 | 2.8 | 530 | 3.2 | 319 | 1.6 | 176 | 1.3 | 214 | 1.2 |
| 62. Rubber manufactures,n.e.s. | 4 | 0.0 | ||||||||
| 63. Wood and cork manufactures | 1 | 0.0 | 15 | 0.1 | ||||||
| 64. Paper,paperboard and articles thereof | 1 | 0.0 | 22 | 0.1 | ||||||
| 65. Textile yarn,fabrics,made up articles,etc. | 1 | 0.0 | 4 | 0.0 | ||||||
| 66. Non-metallic mineral manufactures,n.e.s. | 12 | 0.1 | 17 | 0.1 | 15 | 0.1 | 8 | 0.1 | 64 | 0.3 |
| 67. Iron and steel | 127 | 0.9 | 398 | 2.4 | 229 | 1.2 | 128 | 1.0 | 1 | 0.0 |
| 68. Non-ferrous metals | 192 | 1.4 | 86 | 0.5 | 68 | 0.3 | 4 | 0.0 | 10 | 0.1 |
| 69. Manufactures of metals,n.e.s. | 45 | 0.3 | 28 | 0.2 | 7 | 0.0 | 31 | 0.2 | 102 | 0.6 |
| 7. Machinery,transport equipment | 431 | 3.2 | 172 | 1.0 | 213 | 1.1 | 236 | 1.8 | 180 | 1.0 |
| 71. Power generating machinery and equipment | 1 | 0.0 | ||||||||
| 72. Machinery for specialized industries | 303 | 2.2 | 57 | 0.3 | 50 | 0.3 | 7 | 0.1 | 71 | 0.4 |
| 73. Metal working machinery | 1 | 0.0 | 2 | 0.0 | 2 | 0.0 | 35 | 0.3 | ||
| 74. General industrial machinery n.e.s. | 46 | 0.3 | 55 | 0.3 | 15 | 0.1 | 21 | 0.2 | 68 | 0.4 |
| 75. Office machines and adp machines | 7 | 0.1 | 21 | 0.1 | 61 | 0.3 | 3 | 0.0 | 3 | 0.0 |
| 76. Telecommunications and sound recording equipment | 6 | 0.0 | 8 | 0.0 | 4 | 0.0 | 6 | 0.0 | 5 | 0.0 |
| 77. Electric machinery,n.e.s.and parts | 39 | 0.3 | 4 | 0.0 | 54 | 0.3 | 147 | 1.1 | 17 | 0.1 |
| 78. Road vehicles | 28 | 0.2 | 24 | 0.1 | 27 | 0.1 | 17 | 0.1 | 13 | 0.1 |
| 8. Miscellaneous manufactured articles | 12,687 | 93.0 | 15,870 | 95.3 | 19,294 | 97.1 | 12,588 | 96.5 | 17,879 | 97.6 |
| 81. Prefabr.buildings;sanitary,lighting etc.fixtrs | 6 | 0.0 | 14 | 0.1 | 6 | 0.0 | 1 | 0.0 | ||
| 82. Furniture and parts thereof | 6 | 0.0 | 39 | 0.2 | 28 | 0.1 | 153 | 1.2 | 11 | 0.1 |
| 83. Travel goods,handbags and sim.containers | 1 | 0.0 | 1 | 0.0 | ||||||
| 84. Articles of apparel and clothing accessories | 4 | 0.0 | 4 | 0.0 | 4 | 0.0 | 1 | 0.0 | ||
| 87. Instruments and apparates n.e.s. | 12,669 | 92.9 | 15,810 | 94.9 | 19,240 | 96.9 | 12,395 | 95.0 | 17,855 | 97.5 |
| 89. Miscellaneous manufactured articles,n.e.s. | 3 | 0.0 | 2 | 0.0 | 15 | 0.1 | 38 | 0.3 | 13 | 0.1 |
| All groups combined | 13,638 | 100.0 | 16,652 | 100.0 | 19,864 | 100.0 | 13,045 | 100.0 | 18,320 | 100.0 |
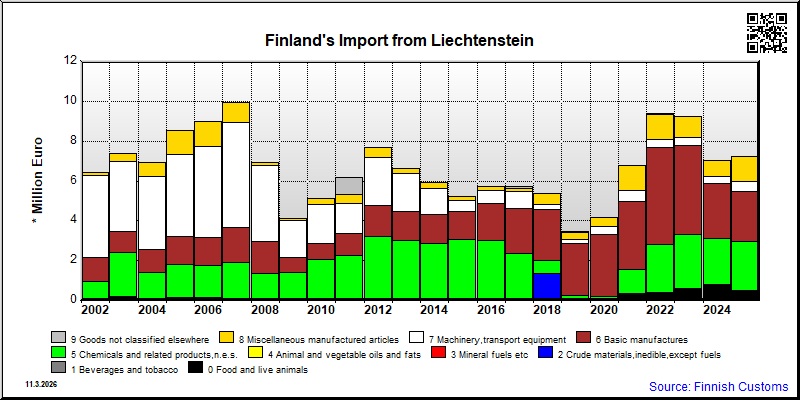
| 2021 | 2022 | 2023 | 2024 | 2025 | ||||||
|---|---|---|---|---|---|---|---|---|---|---|
| 1,000 € | % | 1,000 € | % | 1,000 € | % | 1,000 € | % | 1,000 € | % | |
| 0. Food and live animals | 335 | 4.9 | 395 | 4.2 | 610 | 6.6 | 827 | 11.7 | 478 | 6.6 |
| 01. Meat and meat preparations | 2 | 0.0 | ||||||||
| 05. Vegetables and fruit | 30 | 0.3 | 21 | 0.3 | 28 | 0.4 | ||||
| 06. Sugars,sugar preparations and honey | 100 | 1.4 | ||||||||
| 08. Feeding stuff for animals | 328 | 4.8 | 381 | 4.1 | 576 | 6.2 | 704 | 10.0 | 450 | 6.2 |
| 09. Miscellaneous edible products and preparations | 7 | 0.1 | 14 | 0.1 | 4 | 0.0 | ||||
| 1. Beverages and tobacco | 4 | 0.0 | ||||||||
| 11. Beverages | 4 | 0.0 | ||||||||
| 2. Crude materials,inedible,except fuels | 3 | 0.0 | ||||||||
| 29. Crude animal,vegetable materials n.e.s. | 3 | 0.0 | ||||||||
| 5. Chemicals and related products,n.e.s. | 1,237 | 18.3 | 2,418 | 25.8 | 2,711 | 29.4 | 2,307 | 32.8 | 2,500 | 34.5 |
| 51. Organic chemicals | 22 | 0.3 | 42 | 0.5 | 61 | 0.7 | 43 | 0.6 | 47 | 0.7 |
| 52. Inorganic chemicals | 8 | 0.1 | 4 | 0.0 | 1 | 0.0 | ||||
| 53. Dyeing,tanning and colouring material | 41 | 0.6 | 176 | 1.9 | 149 | 1.6 | 79 | 1.1 | 139 | 1.9 |
| 54. Medicinal and pharmaceutical products | 971 | 14.3 | 1,876 | 20.0 | 2,175 | 23.6 | 1,888 | 26.8 | 2,019 | 27.9 |
| 55. Perfume,cleaning etc.preparations | 7 | 0.1 | 17 | 0.2 | 15 | 0.2 | 15 | 0.2 | 11 | 0.2 |
| 57. Plastics in primary forms | 57 | 0.8 | 112 | 1.2 | 149 | 1.6 | 108 | 1.5 | 118 | 1.6 |
| 58. Plastics in non-primary forms | 99 | 1.5 | 110 | 1.2 | 57 | 0.6 | 81 | 1.1 | 82 | 1.1 |
| 59. Chemical materials and products,n.e.s. | 33 | 0.5 | 82 | 0.9 | 106 | 1.1 | 94 | 1.3 | 83 | 1.1 |
| 6. Basic manufactures | 3,392 | 50.1 | 4,886 | 52.1 | 4,478 | 48.5 | 2,762 | 39.2 | 2,469 | 34.1 |
| 62. Rubber manufactures,n.e.s. | 1 | 0.0 | 2 | 0.0 | 1 | 0.0 | ||||
| 63. Wood and cork manufactures | 31 | 0.5 | 1 | 0.0 | 1 | 0.0 | ||||
| 64. Paper,paperboard and articles thereof | 1 | 0.0 | 6 | 0.1 | 7 | 0.1 | 6 | 0.1 | ||
| 65. Textile yarn,fabrics,made up articles,etc. | 17 | 0.2 | 17 | 0.2 | ||||||
| 66. Non-metallic mineral manufactures,n.e.s. | 428 | 6.3 | 1,055 | 11.3 | 879 | 9.5 | 624 | 8.9 | 722 | 10.0 |
| 67. Iron and steel | 3 | 0.0 | 3 | 0.0 | 14 | 0.2 | 1 | 0.0 | ||
| 68. Non-ferrous metals | 5 | 0.1 | 6 | 0.1 | 8 | 0.1 | ||||
| 69. Manufactures of metals,n.e.s. | 2,923 | 43.2 | 3,824 | 40.8 | 3,573 | 38.7 | 2,093 | 29.7 | 1,730 | 23.9 |
| 7. Machinery,transport equipment | 536 | 7.9 | 409 | 4.4 | 384 | 4.2 | 315 | 4.5 | 497 | 6.9 |
| 71. Power generating machinery and equipment | 1 | 0.0 | 1 | 0.0 | 4 | 0.1 | ||||
| 72. Machinery for specialized industries | 2 | 0.0 | 38 | 0.4 | 72 | 0.8 | 27 | 0.4 | 21 | 0.3 |
| 73. Metal working machinery | 14 | 0.2 | 4 | 0.0 | 31 | 0.4 | 5 | 0.1 | ||
| 74. General industrial machinery n.e.s. | 399 | 5.9 | 239 | 2.6 | 248 | 2.7 | 160 | 2.3 | 377 | 5.2 |
| 75. Office machines and adp machines | 2 | 0.0 | 1 | 0.0 | 3 | 0.0 | 2 | 0.0 | ||
| 76. Telecommunications and sound recording equipment | 1 | 0.0 | 2 | 0.0 | ||||||
| 77. Electric machinery,n.e.s.and parts | 117 | 1.7 | 126 | 1.3 | 58 | 0.6 | 81 | 1.1 | 80 | 1.1 |
| 78. Road vehicles | 3 | 0.0 | 4 | 0.0 | 1 | 0.0 | 8 | 0.1 | 10 | 0.1 |
| 8. Miscellaneous manufactured articles | 1,268 | 18.7 | 1,219 | 13.0 | 1,046 | 11.3 | 829 | 11.8 | 1,290 | 17.8 |
| 81. Prefabr.buildings;sanitary,lighting etc.fixtrs | 1 | 0.0 | ||||||||
| 82. Furniture and parts thereof | 18 | 0.3 | 4 | 0.0 | 8 | 0.1 | ||||
| 87. Instruments and apparates n.e.s. | 1,212 | 17.9 | 1,144 | 12.2 | 995 | 10.8 | 784 | 11.1 | 1,148 | 15.9 |
| 88. Photographic equipment,optical goods etc. | 5 | 0.1 | 1 | 0.0 | ||||||
| 89. Miscellaneous manufactured articles,n.e.s. | 38 | 0.6 | 65 | 0.7 | 42 | 0.5 | 44 | 0.6 | 141 | 2.0 |
| 9. Goods not classified elsewhere | 3 | 0.0 | 47 | 0.5 | 1 | 0.0 | 3 | 0.0 | 1 | 0.0 |
| 93. Special transactions and commodities not classified | 3 | 0.0 | 47 | 0.5 | 1 | 0.0 | 3 | 0.0 | 1 | 0.0 |
| All groups combined | 6,770 | 100.0 | 9,374 | 100.0 | 9,230 | 100.0 | 7,042 | 100.0 | 7,241 | 100.0 |
| Classification | Description | Year level | Quarter level | Month level | |
|---|---|---|---|---|---|
| SITC | Standard International Trade Classification (classification system is maintained by the United Nations) | ███ | |||
| BEC | The standard of statistical classification of BEC (Broad Economic Categories) is upheld by the UN and it is based on SITC-nomenclature. | ███ | |||
| NACE | National industrial classification based on Statistical Classification of Economic Activities in the European Community Nomenclature générale des Activités économiques dans les Communautés européennes | ███ | |||
| CPA | CPA = Classification of Products by Activities | ███ | |||
| CN | The Combined Nomenclature is the common nomenclature of the European Community. | ███ |