
| Export of goods from Finland and import to Finland | BEC (Broad Economic Categories) |
*) The standard of statistical classification of BEC (Broad Economic Categories) is upheld by the UN and it is based on SITC-nomenclature.
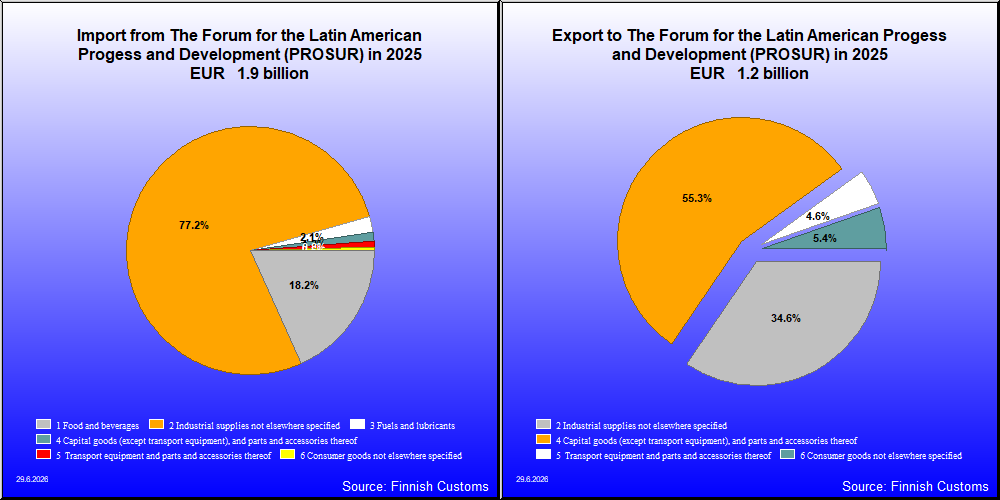

| 2021 | 2022 | 2023 | 2024 | 2025 | ||||||
|---|---|---|---|---|---|---|---|---|---|---|
| 1,000 € | % | 1,000 € | % | 1,000 € | % | 1,000 € | % | 1,000 € | % | |
| 1. Food and beverages | 1,881 | 0.2 | 1,133 | 0.1 | 2,463 | 0.2 | 763 | 0.1 | 530 | 0.0 |
| 11. Food and beverages, primary | 272 | 0.0 | 1 | 0.0 | 2 | 0.0 | 1 | 0.0 | ||
| 111. Food and beverages, primary, mainly for industry | 1 | 0.0 | ||||||||
| 112. Food and beverages, primary, mainly for household consumption | 272 | 0.0 | 2 | 0.0 | ||||||
| 12. Food and beverages, processed | 1,881 | 0.2 | 860 | 0.0 | 2,462 | 0.2 | 761 | 0.1 | 530 | 0.0 |
| 121. Food and beverages, processed, mainly for industry | 1,586 | 0.1 | 491 | 0.0 | 2,306 | 0.2 | 408 | 0.0 | 386 | 0.0 |
| 122. Food and beverages, processed, mainly for household consumption | 294 | 0.0 | 370 | 0.0 | 156 | 0.0 | 353 | 0.0 | 144 | 0.0 |
| 2. Industrial supplies not elsewhere specified | 483,888 | 45.2 | 622,576 | 34.7 | 403,173 | 32.2 | 379,216 | 34.1 | 405,346 | 34.6 |
| 21. Industrial supplies not elsewhere specified, primary | 399 | 0.0 | 257 | 0.0 | 489 | 0.0 | 390 | 0.0 | 276 | 0.0 |
| 22. Industrial supplies not elsewhere specified, processed | 483,490 | 45.2 | 622,319 | 34.7 | 402,685 | 32.2 | 378,826 | 34.1 | 405,071 | 34.5 |
| 3. Fuels and lubricants | 19,397 | 1.8 | 318,928 | 17.8 | 955 | 0.1 | 32,482 | 2.9 | 958 | 0.1 |
| 31. Fuels and lubricants, primary | 586 | 0.1 | 1,849 | 0.1 | 894 | 0.1 | 1,900 | 0.2 | 893 | 0.1 |
| 32. Fuels and lubricants, processed | 18,811 | 1.8 | 317,079 | 17.7 | 61 | 0.0 | 30,582 | 2.7 | 65 | 0.0 |
| 321. Fuels and lubricants, motor spirit | 18,791 | 1.8 | 316,752 | 17.7 | 30,521 | 2.7 | ||||
| 322. Fuels and lubricants, other | 20 | 0.0 | 327 | 0.0 | 61 | 0.0 | 3,408 | 0.3 | 65 | 0.0 |
| 4. Capital goods (except transport equipment), and parts and accessories thereof | 499,464 | 46.7 | 746,634 | 41.6 | 723,527 | 57.8 | 572,507 | 51.5 | 648,063 | 55.3 |
| 41. Capital goods (except transport equipment) | 256,394 | 24.0 | 434,211 | 24.2 | 370,470 | 29.6 | 333,750 | 30.0 | 382,894 | 32.6 |
| 42. Capital goods (except transport equipment), parts and accessories | 243,070 | 22.7 | 312,422 | 17.4 | 353,057 | 28.2 | 238,756 | 21.5 | 265,169 | 22.6 |
| 5. Transport equipment and parts and accessories thereof | 47,909 | 4.5 | 76,435 | 4.3 | 77,597 | 6.2 | 61,044 | 5.5 | 54,331 | 4.6 |
| 51. Passenger motor vehicles | 1 | 0.0 | 360 | 0.0 | 304 | 0.0 | 972 | 0.1 | ||
| 52. Transport equipment, other than passenger motor vehicles | 29,941 | 2.8 | 55,205 | 3.1 | 55,703 | 4.5 | 35,956 | 3.2 | 29,269 | 2.5 |
| 521. Transport equipment, other than passenger motor vehicles, industrial | 29,941 | 2.8 | 55,198 | 3.1 | 55,699 | 4.5 | 35,809 | 3.2 | 25,905 | 2.2 |
| 522. Transport equipment, other than passenger motor vehicles, non-industrial | 8 | 0.0 | 4 | 0.0 | 146 | 0.0 | 3,364 | 0.3 | ||
| 53. Transport equipment, parts and accessories | 17,967 | 1.7 | 21,230 | 1.2 | 21,534 | 1.7 | 24,785 | 2.2 | 24,089 | 2.1 |
| 6. Consumer goods not elsewhere specified | 16,061 | 1.5 | 27,046 | 1.5 | 31,601 | 2.5 | 55,945 | 5.0 | 63,444 | 5.4 |
| 61. Consumer goods not elsewhere specified, durable | 512 | 0.0 | 964 | 0.1 | 1,154 | 0.1 | 1,060 | 0.1 | 1,604 | 0.1 |
| 62. Consumer goods not elsewhere specified, semi-durable | 4,615 | 0.4 | 5,666 | 0.3 | 3,317 | 0.3 | 4,122 | 0.4 | 3,787 | 0.3 |
| 63. Consumer goods not elsewhere specified, non-durable | 10,934 | 1.0 | 20,416 | 1.1 | 27,130 | 2.2 | 50,765 | 4.6 | 58,053 | 5.0 |
| 7. Goods not elsewhere specified | 821 | 0.1 | 961 | 0.1 | 11,640 | 0.9 | 10,216 | 0.9 | 95 | 0.0 |
| All groups | 1,069,421 | 100.0 | 1,793,712 | 100.0 | 1,250,957 | 100.0 | 1,112,174 | 100.0 | 1,172,768 | 100.0 |

| 2021 | 2022 | 2023 | 2024 | 2025 | ||||||
|---|---|---|---|---|---|---|---|---|---|---|
| 1,000 € | % | 1,000 € | % | 1,000 € | % | 1,000 € | % | 1,000 € | % | |
| 1. Food and beverages | 223,407 | 19.3 | 313,722 | 19.0 | 265,545 | 18.1 | 289,616 | 21.8 | 339,425 | 18.2 |
| 11. Food and beverages, primary | 170,061 | 14.7 | 227,833 | 13.8 | 191,309 | 13.1 | 213,294 | 16.0 | 274,984 | 14.8 |
| 111. Food and beverages, primary, mainly for industry | 114,283 | 9.9 | 179,427 | 10.9 | 126,441 | 8.6 | 163,443 | 12.3 | 203,895 | 11.0 |
| 112. Food and beverages, primary, mainly for household consumption | 55,778 | 4.8 | 48,406 | 2.9 | 64,868 | 4.4 | 49,851 | 3.7 | 71,089 | 3.8 |
| 12. Food and beverages, processed | 53,345 | 4.6 | 85,889 | 5.2 | 74,236 | 5.1 | 76,322 | 5.7 | 64,441 | 3.5 |
| 121. Food and beverages, processed, mainly for industry | 4,397 | 0.4 | 28,816 | 1.7 | 20,358 | 1.4 | 10,644 | 0.8 | 2,552 | 0.1 |
| 122. Food and beverages, processed, mainly for household consumption | 48,948 | 4.2 | 57,073 | 3.5 | 53,878 | 3.7 | 65,678 | 4.9 | 61,890 | 3.3 |
| 2. Industrial supplies not elsewhere specified | 878,313 | 76.0 | 1,136,919 | 68.8 | 1,049,069 | 71.6 | 941,252 | 70.8 | 1,435,994 | 77.2 |
| 21. Industrial supplies not elsewhere specified, primary | 786,958 | 68.1 | 820,965 | 49.7 | 778,259 | 53.1 | 697,192 | 52.4 | 1,187,825 | 63.8 |
| 22. Industrial supplies not elsewhere specified, processed | 91,355 | 7.9 | 315,954 | 19.1 | 270,810 | 18.5 | 244,060 | 18.4 | 248,169 | 13.3 |
| 3. Fuels and lubricants | 22,581 | 2.0 | 155,991 | 9.4 | 104,408 | 7.1 | 53,279 | 4.0 | 38,412 | 2.1 |
| 31. Fuels and lubricants, primary | 91,931 | 5.6 | 48,385 | 3.3 | ||||||
| 32. Fuels and lubricants, processed | 22,581 | 2.0 | 64,060 | 3.9 | 56,023 | 3.8 | 53,279 | 4.0 | 38,412 | 2.1 |
| 321. Fuels and lubricants, motor spirit | 26 | 0.0 | ||||||||
| 322. Fuels and lubricants, other | 22,555 | 2.0 | 64,060 | 3.9 | 56,023 | 3.8 | 53,279 | 4.0 | 38,412 | 2.1 |
| 4. Capital goods (except transport equipment), and parts and accessories thereof | 12,823 | 1.1 | 21,873 | 1.3 | 19,474 | 1.3 | 22,909 | 1.7 | 22,691 | 1.2 |
| 41. Capital goods (except transport equipment) | 7,881 | 0.7 | 15,081 | 0.9 | 11,482 | 0.8 | 12,228 | 0.9 | 15,783 | 0.8 |
| 42. Capital goods (except transport equipment), parts and accessories | 4,942 | 0.4 | 6,792 | 0.4 | 7,992 | 0.5 | 10,681 | 0.8 | 6,908 | 0.4 |
| 5. Transport equipment and parts and accessories thereof | 12,579 | 1.1 | 15,049 | 0.9 | 15,571 | 1.1 | 11,366 | 0.9 | 14,131 | 0.8 |
| 51. Passenger motor vehicles | 38 | 0.0 | 96 | 0.0 | ||||||
| 52. Transport equipment, other than passenger motor vehicles | 25 | 0.0 | 12 | 0.0 | 589 | 0.0 | 5 | 0.0 | 4,975 | 0.3 |
| 521. Transport equipment, other than passenger motor vehicles, industrial | 10 | 0.0 | 546 | 0.0 | 5 | 0.0 | 4,975 | 0.3 | ||
| 522. Transport equipment, other than passenger motor vehicles, non-industrial | 15 | 0.0 | 12 | 0.0 | 43 | 0.0 | ||||
| 53. Transport equipment, parts and accessories | 12,517 | 1.1 | 14,941 | 0.9 | 14,982 | 1.0 | 11,361 | 0.9 | 9,156 | 0.5 |
| 6. Consumer goods not elsewhere specified | 5,568 | 0.5 | 7,859 | 0.5 | 8,667 | 0.6 | 9,862 | 0.7 | 9,508 | 0.5 |
| 61. Consumer goods not elsewhere specified, durable | 375 | 0.0 | 293 | 0.0 | 142 | 0.0 | 221 | 0.0 | 219 | 0.0 |
| 62. Consumer goods not elsewhere specified, semi-durable | 2,190 | 0.2 | 2,747 | 0.2 | 3,354 | 0.2 | 2,181 | 0.2 | 1,825 | 0.1 |
| 63. Consumer goods not elsewhere specified, non-durable | 3,004 | 0.3 | 4,819 | 0.3 | 5,171 | 0.4 | 7,460 | 0.6 | 7,464 | 0.4 |
| 7. Goods not elsewhere specified | 809 | 0.1 | 1,776 | 0.1 | 1,879 | 0.1 | 1,141 | 0.1 | 853 | 0.0 |
| All groups | 1,156,077 | 100.0 | 1,653,189 | 100.0 | 1,464,612 | 100.0 | 1,329,424 | 100.0 | 1,861,014 | 100.0 |
| Classification | Description | Year level | Quarter level | Month level | |
|---|---|---|---|---|---|
| SITC | Standard International Trade Classification (classification system is maintained by the United Nations) | ███ | ███ | ███ | |
| BEC | The standard of statistical classification of BEC (Broad Economic Categories) is upheld by the UN and it is based on SITC-nomenclature. | ███ | ███ | ███ | |
| NACE | National industrial classification based on Statistical Classification of Economic Activities in the European Community Nomenclature générale des Activités économiques dans les Communautés européennes | ███ | ███ | ███ | |
| CPA | CPA = Classification of Products by Activities | ███ | ███ | ███ | |
| CN | The Combined Nomenclature is the common nomenclature of the European Community. | ███ | ███ | ███ |