
| Export of goods from Finland and import to Finland | Trade Balance |

| Import 1,000 € | Export 1,000 € | Trade 1,000 € | Trade Balance 1,000 € | |
|---|---|---|---|---|
| 2019 Q1 | 2,430,159 | 1,100,571 | 3,530,730 | -1,329,588 |
| 2019 Q2 | 2,461,609 | 1,365,365 | 3,826,974 | -1,096,244 |
| 2019 Q3 | 2,407,615 | 1,371,208 | 3,778,823 | -1,036,407 |
| 2019 Q4 | 2,436,929 | 1,474,335 | 3,911,264 | -962,594 |
| 2020 Q1 | 2,030,725 | 1,071,067 | 3,101,792 | -959,658 |
| 2020 Q2 | 1,310,403 | 1,040,948 | 2,351,351 | -269,456 |
| 2020 Q3 | 1,678,624 | 1,094,309 | 2,772,933 | -584,316 |
| 2020 Q4 | 1,687,021 | 1,183,994 | 2,871,015 | -503,026 |
| 2021 Q1 | 2,227,054 | 1,118,361 | 3,345,415 | -1,108,693 |
| 2021 Q2 | 1,817,596 | 1,329,097 | 3,146,693 | -488,499 |
| 2021 Q3 | 2,344,531 | 1,255,404 | 3,599,935 | -1,089,128 |
| 2021 Q4 | 3,360,581 | 1,378,445 | 4,739,027 | -1,982,136 |
| 2022 Q1 | 3,435,781 | 1,166,989 | 4,602,770 | -2,268,792 |
| 2022 Q2 | 1,658,253 | 1,022,929 | 2,681,182 | -635,324 |
| 2022 Q3 | 1,368,544 | 923,969 | 2,292,513 | -444,576 |
| 2022 Q4 | 1,149,177 | 1,075,167 | 2,224,344 | -74,010 |
| 2023 Q1 | 680,325 | 750,939 | 1,431,263 | 70,614 |
| 2023 Q2 | 465,559 | 658,868 | 1,124,427 | 193,308 |
| 2023 Q3 | 606,793 | 616,295 | 1,223,087 | 9,502 |
| 2023 Q4 | 597,411 | 615,742 | 1,213,153 | 18,331 |
| 2024 Q1 | 470,052 | 471,327 | 941,379 | 1,275 |
| 2024 Q2 | 516,637 | 610,915 | 1,127,552 | 94,278 |
| 2024 Q3 | 558,913 | 564,924 | 1,123,837 | 6,011 |
| 2024 Q4 | 428,740 | 581,527 | 1,010,268 | 152,787 |
| 2025 Q1 | 437,081 | 569,921 | 1,007,003 | 132,840 |
| 2025 Q2 | 444,280 | 521,101 | 965,381 | 76,821 |
| 2025 Q3 | 973,869 | 516,675 | 1,490,544 | -457,194 |
| 2025 Q4 | 633,935 | 648,972 | 1,282,907 | 15,038 |
| 2026 Q1 | 618,737 | 451,438 | 1,070,175 | -167,300 |
| 2026 Q2 | 672,222 | 530,091 | 1,202,313 | -142,132 |
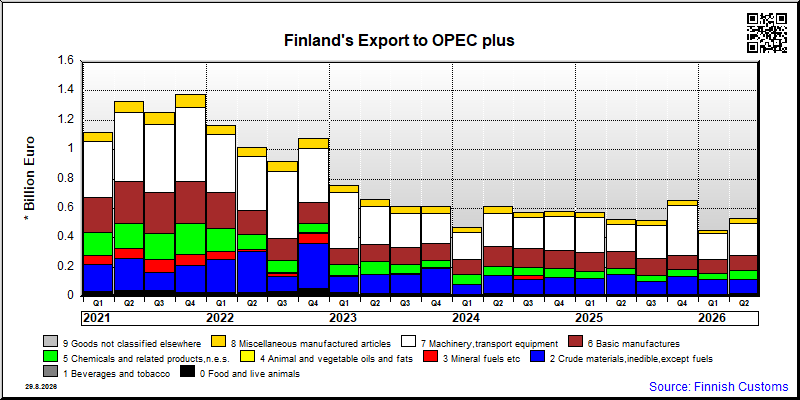
| Q2 / 2026 | Q2 / 2025 | Muutos edellisestä vastaavasta kaudesta % | ||
|---|---|---|---|---|
| 1,000 € | % | 1,000 € | ||
| 0. Food and live animals | 20,083 | 3.8 | 12,856 | 56.2 |
| 1. Beverages and tobacco | 289 | 0.1 | 223 | 29.9 |
| 2. Crude materials,inedible,except fuels | 94,591 | 17.8 | 136,570 | -30.7 |
| 3. Mineral fuels etc | 904 | 0.2 | 1,132 | -20.2 |
| 4. Animal and vegetable oils and fats | 187 | 0.0 | 207 | -9.7 |
| 5. Chemicals and related products,n.e.s. | 58,832 | 11.1 | 37,609 | 56.4 |
| 6. Basic manufactures | 103,644 | 19.6 | 115,104 | -10.0 |
| 7. Machinery,transport equipment | 217,811 | 41.1 | 183,375 | 18.8 |
| 8. Miscellaneous manufactured articles | 33,736 | 6.4 | 33,838 | -0.3 |
| 9. Goods not classified elsewhere | 13 | 0.0 | 0 | .. |
| All groups combined | 530,091 | 100.0 | 520,913 | 1.8 |

| Q2 / 2026 | Q2 / 2025 | Muutos edellisestä vastaavasta kaudesta % | ||
|---|---|---|---|---|
| 1,000 € | % | 1,000 € | ||
| 0. Food and live animals | 17,491 | 2.6 | 10,295 | 69.9 |
| 1. Beverages and tobacco | 696 | 0.1 | 1,411 | -50.7 |
| 2. Crude materials,inedible,except fuels | 325,257 | 48.4 | 225,229 | 44.4 |
| 3. Mineral fuels etc | 16,383 | 2.4 | 44,925 | -63.5 |
| 4. Animal and vegetable oils and fats | 2,701 | 0.4 | 112 | .. |
| 5. Chemicals and related products,n.e.s. | 54,780 | 8.1 | 38,757 | 41.3 |
| 6. Basic manufactures | 18,620 | 2.8 | 17,683 | 5.3 |
| 7. Machinery,transport equipment | 208,035 | 30.9 | 83,830 | 148.2 |
| 8. Miscellaneous manufactured articles | 28,177 | 4.2 | 20,620 | 36.7 |
| 9. Goods not classified elsewhere | 118 | 0.0 | 141 | -16.0 |
| All groups combined | 672,222 | 100.0 | 443,002 | 51.7 |
| Classification | Description | Year level | Quarter level | Month level | Year 2026 sofar |
|---|---|---|---|---|---|
| SITC | Standard International Trade Classification (classification system is maintained by the United Nations) | ███ | ███ | ███ | ███ |
| BEC | The standard of statistical classification of BEC (Broad Economic Categories) is upheld by the UN and it is based on SITC-nomenclature. | ███ | ███ | ███ | ███ |
| NACE | National industrial classification based on Statistical Classification of Economic Activities in the European Community Nomenclature générale des Activités économiques dans les Communautés européennes | ███ | ███ | ███ | ███ |
| CPA | CPA = Classification of Products by Activities | ███ | ███ | ███ | ███ |
| CN | The Combined Nomenclature is the common nomenclature of the European Community. | ███ | ███ | ███ | ███ |