
| Export of goods from Finland and import to Finland | BEC (Broad Economic Categories) |
*) The standard of statistical classification of BEC (Broad Economic Categories) is upheld by the UN and it is based on SITC-nomenclature.

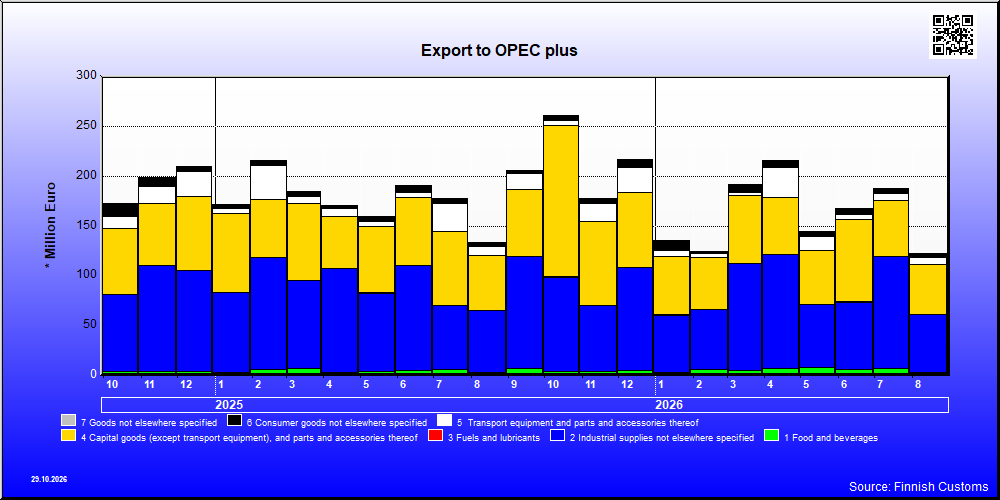
| 8 / 2026 | 8 / 2025 | Change from previous year's equal month % | ||
|---|---|---|---|---|
| 1,000 € | % | 1000 € | ||
| 1. Food and beverages | 3,351 | 2.7 | 2,992 | 12.0 |
| 11. Food and beverages, primary | 143 | 0.1 | 27 | 421.4 |
| 111. Food and beverages, primary, mainly for industry | 0 | 0 | 0 | .. |
| 112. Food and beverages, primary, mainly for household consumption | 143 | 0.1 | 27 | 421.9 |
| 12. Food and beverages, processed | 3,209 | 2.6 | 2,965 | 8.2 |
| 121. Food and beverages, processed, mainly for industry | 2,128 | 1.7 | 1,797 | 18.5 |
| 122. Food and beverages, processed, mainly for household consumption | 1,081 | 0.9 | 1,168 | -7.5 |
| 2. Industrial supplies not elsewhere specified | 57,658 | 47.0 | 61,861 | -6.8 |
| 21. Industrial supplies not elsewhere specified, primary | 253 | 0.2 | 580 | -56.4 |
| 22. Industrial supplies not elsewhere specified, processed | 57,405 | 46.7 | 61,281 | -6.3 |
| 3. Fuels and lubricants | 282 | 0.2 | 307 | -8.2 |
| 31. Fuels and lubricants, primary | 270 | 0.2 | 305 | -11.3 |
| 32. Fuels and lubricants, processed | 12 | 0.0 | 2 | 381.0 |
| 322. Fuels and lubricants, other | 12 | 0.0 | 2 | 381.0 |
| 4. Capital goods (except transport equipment), and parts and accessories thereof | 50,287 | 40.9 | 55,596 | -9.5 |
| 41. Capital goods (except transport equipment) | 29,559 | 24.1 | 32,292 | -8.5 |
| 42. Capital goods (except transport equipment), parts and accessories | 20,728 | 16.9 | 23,304 | -11.1 |
| 5. Transport equipment and parts and accessories thereof | 6,880 | 5.6 | 9,061 | -24.1 |
| 51. Passenger motor vehicles | 91 | 0.1 | 36 | 151.8 |
| 52. Transport equipment, other than passenger motor vehicles | 1,014 | 0.8 | 3,485 | -70.9 |
| 521. Transport equipment, other than passenger motor vehicles, industrial | 553 | 0.5 | 549 | 0.7 |
| 522. Transport equipment, other than passenger motor vehicles, non-industrial | 461 | 0.4 | 2,936 | -84.3 |
| 53. Transport equipment, parts and accessories | 5,776 | 4.7 | 5,539 | 4.3 |
| 6. Consumer goods not elsewhere specified | 4,045 | 3.3 | 3,436 | 17.7 |
| 61. Consumer goods not elsewhere specified, durable | 1,107 | 0.9 | 528 | 109.6 |
| 62. Consumer goods not elsewhere specified, semi-durable | 1,629 | 1.3 | 1,127 | 44.6 |
| 63. Consumer goods not elsewhere specified, non-durable | 1,309 | 1.1 | 1,781 | -26.5 |
| 7. Goods not elsewhere specified | 299 | 0.2 | 6 | .. |
| All groups | 122,803 | 100.0 | 133,259 | -7.8 |

| 8 / 2026 | 8 / 2025 | Change from previous year's equal month % | ||
|---|---|---|---|---|
| 1,000 € | % | 1,000 € | ||
| 1. Food and beverages | 6,012 | 1.7 | 2,918 | 106.1 |
| 11. Food and beverages, primary | 3,454 | 1.0 | 1,746 | 97.8 |
| 111. Food and beverages, primary, mainly for industry | 1,070 | 0.3 | 32 | .. |
| 112. Food and beverages, primary, mainly for household consumption | 2,385 | 0.7 | 1,714 | 39.1 |
| 12. Food and beverages, processed | 2,558 | 0.7 | 1,172 | 118.3 |
| 121. Food and beverages, processed, mainly for industry | 246 | 0.1 | 36 | 577.3 |
| 122. Food and beverages, processed, mainly for household consumption | 2,312 | 0.7 | 1,135 | 103.6 |
| 2. Industrial supplies not elsewhere specified | 148,153 | 41.7 | 97,631 | 51.7 |
| 21. Industrial supplies not elsewhere specified, primary | 32,937 | 9.3 | 21,971 | 49.9 |
| 22. Industrial supplies not elsewhere specified, processed | 115,216 | 32.4 | 75,661 | 52.3 |
| 3. Fuels and lubricants | 859 | 0.2 | 29,212 | -97.1 |
| 32. Fuels and lubricants, processed | 859 | 0.2 | 29,212 | -97.1 |
| 322. Fuels and lubricants, other | 859 | 0.2 | 29,212 | -97.1 |
| 4. Capital goods (except transport equipment), and parts and accessories thereof | 186,583 | 52.5 | 129,934 | 43.6 |
| 41. Capital goods (except transport equipment) | 175,788 | 49.5 | 121,361 | 44.8 |
| 42. Capital goods (except transport equipment), parts and accessories | 10,795 | 3.0 | 8,573 | 25.9 |
| 5. Transport equipment and parts and accessories thereof | 7,895 | 2.2 | 4,946 | 59.6 |
| 51. Passenger motor vehicles | 2,634 | 0.7 | 1,733 | 52.0 |
| 52. Transport equipment, other than passenger motor vehicles | 3,012 | 0.8 | 831 | 262.2 |
| 521. Transport equipment, other than passenger motor vehicles, industrial | 3,011 | 0.8 | 831 | 262.2 |
| 522. Transport equipment, other than passenger motor vehicles, non-industrial | 0 | 0.0 | 0 | .. |
| 53. Transport equipment, parts and accessories | 2,249 | 0.6 | 2,381 | -5.5 |
| 6. Consumer goods not elsewhere specified | 5,828 | 1.6 | 3,629 | 60.6 |
| 61. Consumer goods not elsewhere specified, durable | 3,180 | 0.9 | 1,917 | 65.9 |
| 62. Consumer goods not elsewhere specified, semi-durable | 1,351 | 0.4 | 831 | 62.7 |
| 63. Consumer goods not elsewhere specified, non-durable | 1,297 | 0.4 | 881 | 47.1 |
| 7. Goods not elsewhere specified | 27 | 0.0 | 66 | -59.6 |
| All groups | 355,357 | 100.0 | 268,337 | 32.4 |
| Classification | Description | Year level | Quarter level | Month level | Year 2026 sofar |
|---|---|---|---|---|---|
| SITC | Standard International Trade Classification (classification system is maintained by the United Nations) | ███ | ███ | ███ | ███ |
| BEC | The standard of statistical classification of BEC (Broad Economic Categories) is upheld by the UN and it is based on SITC-nomenclature. | ███ | ███ | ███ | ███ |
| NACE | National industrial classification based on Statistical Classification of Economic Activities in the European Community Nomenclature générale des Activités économiques dans les Communautés européennes | ███ | ███ | ███ | ███ |
| CPA | CPA = Classification of Products by Activities | ███ | ███ | ███ | ███ |
| CN | The Combined Nomenclature is the common nomenclature of the European Community. | ███ | ███ | ███ | ███ |