
| Export of goods from Finland and import to Finland | BEC (Broad Economic Categories) |
*) The standard of statistical classification of BEC (Broad Economic Categories) is upheld by the UN and it is based on SITC-nomenclature.
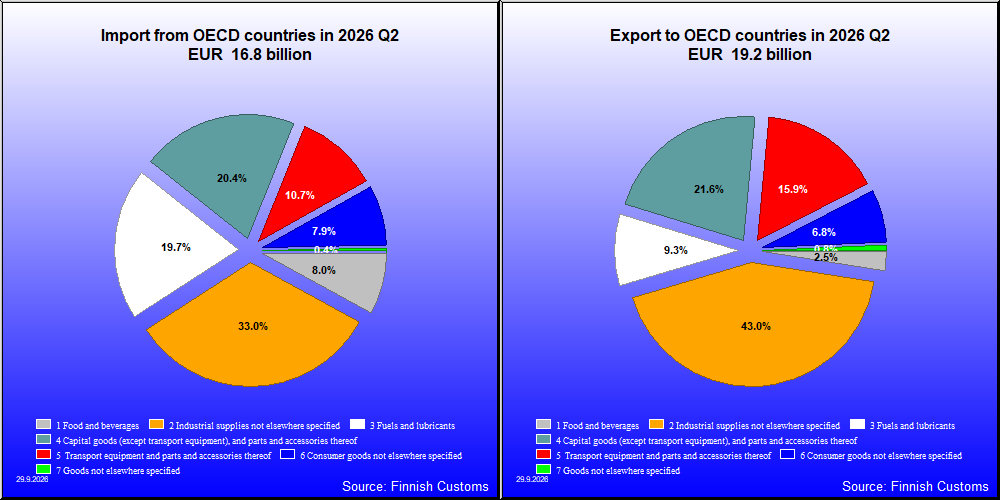

| Q2 / 2026 | Q2 / 2025 | Muutos edellisestä vastaavasta kaudesta % | ||
|---|---|---|---|---|
| 1,000 € | % | 1,000 € | ||
| 1. Food and beverages | 476,732 | 2.5 | 445,331 | 7.1 |
| 11. Food and beverages, primary | 114,002 | 0.6 | 82,303 | 38.5 |
| 111. Food and beverages, primary, mainly for industry | 11,723 | 0.1 | 7,791 | 50.5 |
| 112. Food and beverages, primary, mainly for household consumption | 102,285 | 0.5 | 74,511 | 37.3 |
| 12. Food and beverages, processed | 362,730 | 1.9 | 363,028 | -0.1 |
| 121. Food and beverages, processed, mainly for industry | 62,978 | 0.3 | 50,779 | 24.0 |
| 122. Food and beverages, processed, mainly for household consumption | 299,752 | 1.6 | 312,249 | -4.0 |
| 2. Industrial supplies not elsewhere specified | 8,138,969 | 42.6 | 7,586,479 | 7.3 |
| 21. Industrial supplies not elsewhere specified, primary | 767,958 | 4.0 | 651,790 | 17.8 |
| 22. Industrial supplies not elsewhere specified, processed | 7,371,012 | 38.6 | 6,934,689 | 6.3 |
| 3. Fuels and lubricants | 1,796,183 | 9.4 | 1,332,039 | 34.8 |
| 31. Fuels and lubricants, primary | 104,720 | 0.5 | 55,417 | 89.0 |
| 32. Fuels and lubricants, processed | 1,691,463 | 8.9 | 1,276,622 | 32.5 |
| 321. Fuels and lubricants, motor spirit | 628,213 | 3.3 | 457,859 | 37.2 |
| 322. Fuels and lubricants, other | 1,063,249 | 5.6 | 818,763 | 29.9 |
| 4. Capital goods (except transport equipment), and parts and accessories thereof | 4,149,789 | 21.7 | 3,890,696 | 6.7 |
| 41. Capital goods (except transport equipment) | 3,002,644 | 15.7 | 2,888,778 | 3.9 |
| 42. Capital goods (except transport equipment), parts and accessories | 1,147,145 | 6.0 | 1,001,919 | 14.5 |
| 5. Transport equipment and parts and accessories thereof | 3,057,473 | 16.0 | 1,410,830 | 116.7 |
| 51. Passenger motor vehicles | 86,255 | 0.5 | 224,663 | -61.6 |
| 52. Transport equipment, other than passenger motor vehicles | 2,425,850 | 12.7 | 707,006 | 243.1 |
| 521. Transport equipment, other than passenger motor vehicles, industrial | 2,331,821 | 12.2 | 594,594 | 292.2 |
| 522. Transport equipment, other than passenger motor vehicles, non-industrial | 94,029 | 0.5 | 112,530 | -16.4 |
| 53. Transport equipment, parts and accessories | 545,367 | 2.9 | 479,161 | 13.8 |
| 6. Consumer goods not elsewhere specified | 1,313,518 | 6.9 | 674,619 | 94.7 |
| 61. Consumer goods not elsewhere specified, durable | 97,677 | 0.5 | 100,086 | -2.4 |
| 62. Consumer goods not elsewhere specified, semi-durable | 244,715 | 1.3 | 234,357 | 4.4 |
| 63. Consumer goods not elsewhere specified, non-durable | 971,125 | 5.1 | 340,176 | 185.5 |
| 7. Goods not elsewhere specified | 151,993 | 0.8 | 127,662 | 19.1 |
| All groups | 19,084,656 | 100.0 | 15,467,656 | 23.4 |
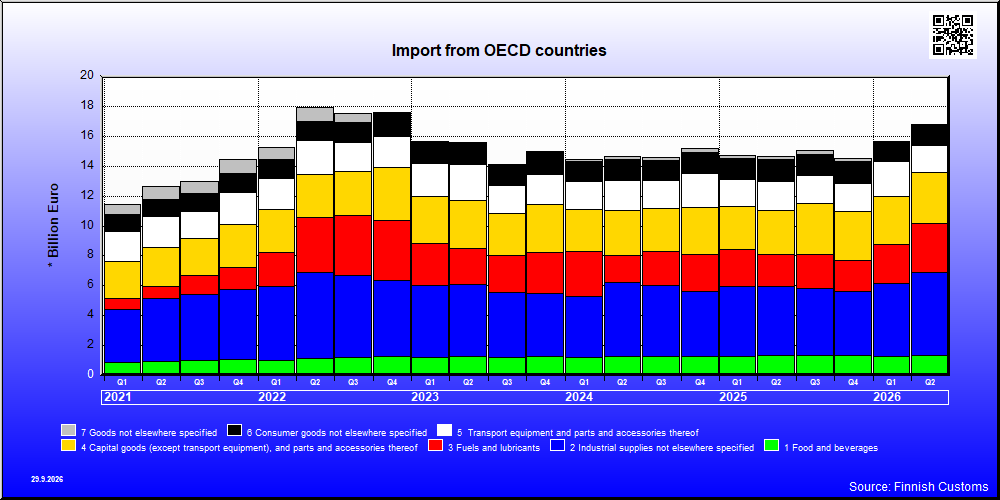
| Q2 / 2026 | Q2 / 2025 | Muutos edellisestä vastaavasta kaudesta % | ||
|---|---|---|---|---|
| 1,000 € | % | 1,000 € | ||
| 1. Food and beverages | 1,330,747 | 8.0 | 1,336,371 | -0.4 |
| 11. Food and beverages, primary | 339,873 | 2.0 | 300,480 | 13.1 |
| 111. Food and beverages, primary, mainly for industry | 42,587 | 0.3 | 21,019 | 102.6 |
| 112. Food and beverages, primary, mainly for household consumption | 297,297 | 1.8 | 279,461 | 6.4 |
| 12. Food and beverages, processed | 990,874 | 5.9 | 1,035,891 | -4.3 |
| 121. Food and beverages, processed, mainly for industry | 65,988 | 0.4 | 98,426 | -33.0 |
| 122. Food and beverages, processed, mainly for household consumption | 924,888 | 5.5 | 937,465 | -1.3 |
| 2. Industrial supplies not elsewhere specified | 5,482,246 | 32.8 | 4,605,774 | 19.0 |
| 21. Industrial supplies not elsewhere specified, primary | 1,051,963 | 6.3 | 873,444 | 20.4 |
| 22. Industrial supplies not elsewhere specified, processed | 4,430,283 | 26.5 | 3,732,330 | 18.7 |
| 3. Fuels and lubricants | 3,297,993 | 19.8 | 2,147,914 | 53.5 |
| 31. Fuels and lubricants, primary | 2,138,227 | 12.8 | 1,269,118 | 68.5 |
| 32. Fuels and lubricants, processed | 1,159,766 | 6.9 | 878,797 | 32.0 |
| 321. Fuels and lubricants, motor spirit | 154,840 | 0.9 | 110,703 | 39.9 |
| 322. Fuels and lubricants, other | 1,004,926 | 6.0 | 768,094 | 30.8 |
| 4. Capital goods (except transport equipment), and parts and accessories thereof | 3,380,083 | 20.3 | 2,932,505 | 15.3 |
| 41. Capital goods (except transport equipment) | 2,089,512 | 12.5 | 1,792,446 | 16.6 |
| 42. Capital goods (except transport equipment), parts and accessories | 1,290,571 | 7.7 | 1,140,058 | 13.2 |
| 5. Transport equipment and parts and accessories thereof | 1,804,605 | 10.8 | 1,977,277 | -8.7 |
| 51. Passenger motor vehicles | 786,082 | 4.7 | 865,400 | -9.2 |
| 52. Transport equipment, other than passenger motor vehicles | 416,706 | 2.5 | 410,044 | 1.6 |
| 521. Transport equipment, other than passenger motor vehicles, industrial | 346,342 | 2.1 | 328,196 | 5.5 |
| 522. Transport equipment, other than passenger motor vehicles, non-industrial | 70,364 | 0.4 | 81,849 | -14.0 |
| 53. Transport equipment, parts and accessories | 601,862 | 3.6 | 701,833 | -14.2 |
| 6. Consumer goods not elsewhere specified | 1,315,985 | 7.9 | 1,434,082 | -8.2 |
| 61. Consumer goods not elsewhere specified, durable | 259,274 | 1.6 | 311,222 | -16.7 |
| 62. Consumer goods not elsewhere specified, semi-durable | 294,050 | 1.8 | 349,778 | -15.9 |
| 63. Consumer goods not elsewhere specified, non-durable | 762,661 | 4.6 | 773,082 | -1.3 |
| 7. Goods not elsewhere specified | 79,389 | 0.5 | 238,454 | -66.7 |
| All groups | 16,691,048 | 100.0 | 14,672,377 | 13.8 |
| Classification | Description | Year level | Quarter level | Month level | Year 2026 sofar |
|---|---|---|---|---|---|
| SITC | Standard International Trade Classification (classification system is maintained by the United Nations) | ███ | ███ | ███ | ███ |
| BEC | The standard of statistical classification of BEC (Broad Economic Categories) is upheld by the UN and it is based on SITC-nomenclature. | ███ | ███ | ███ | ███ |
| NACE | National industrial classification based on Statistical Classification of Economic Activities in the European Community Nomenclature générale des Activités économiques dans les Communautés européennes | ███ | ███ | ███ | ███ |
| CPA | CPA = Classification of Products by Activities | ███ | ███ | ███ | ███ |
| CN | The Combined Nomenclature is the common nomenclature of the European Community. | ███ | ███ | ███ | ███ |