
| Export of goods from Finland and import to Finland | BEC (Broad Economic Categories) |
*) The standard of statistical classification of BEC (Broad Economic Categories) is upheld by the UN and it is based on SITC-nomenclature.

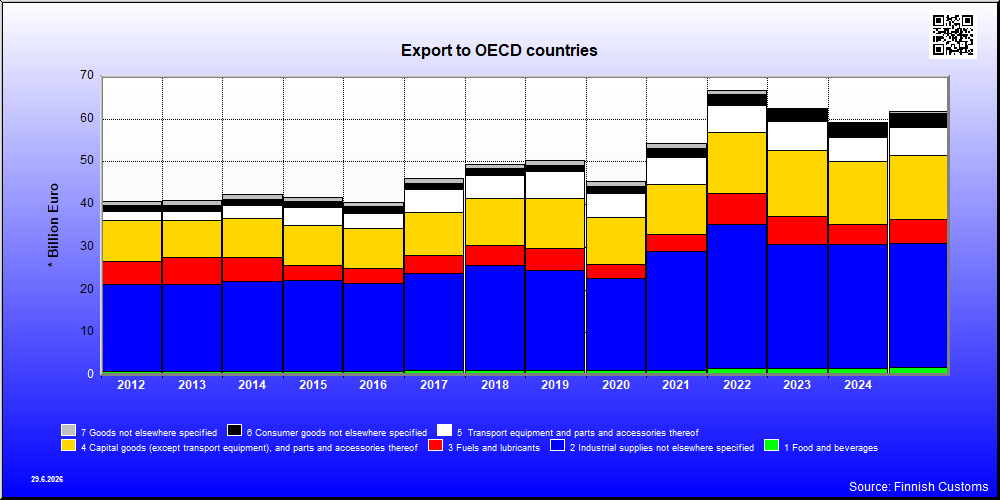
| 2021 | 2022 | 2023 | 2024 | 2025 | ||||||
|---|---|---|---|---|---|---|---|---|---|---|
| 1,000 € | % | 1,000 € | % | 1,000 € | % | 1,000 € | % | 1,000 € | % | |
| 1. Food and beverages | 1,218,374 | 2.2 | 1,587,073 | 2.4 | 1,637,307 | 2.6 | 1,726,407 | 2.9 | 1,864,456 | 3.0 |
| 11. Food and beverages, primary | 275,345 | 0.5 | 406,519 | 0.6 | 395,137 | 0.6 | 383,760 | 0.6 | 422,055 | 0.7 |
| 111. Food and beverages, primary, mainly for industry | 24,361 | 0.0 | 13,389 | 0.0 | 38,669 | 0.1 | 30,020 | 0.1 | 27,476 | 0.0 |
| 112. Food and beverages, primary, mainly for household consumption | 250,984 | 0.5 | 393,130 | 0.6 | 356,468 | 0.6 | 353,740 | 0.6 | 394,579 | 0.6 |
| 12. Food and beverages, processed | 943,029 | 1.7 | 1,180,553 | 1.8 | 1,242,170 | 2.0 | 1,342,648 | 2.3 | 1,442,402 | 2.3 |
| 121. Food and beverages, processed, mainly for industry | 147,894 | 0.3 | 183,081 | 0.3 | 175,137 | 0.3 | 186,781 | 0.3 | 219,259 | 0.4 |
| 122. Food and beverages, processed, mainly for household consumption | 795,136 | 1.5 | 997,472 | 1.5 | 1,067,033 | 1.7 | 1,155,867 | 2.0 | 1,223,142 | 2.0 |
| 2. Industrial supplies not elsewhere specified | 27,761,887 | 51.1 | 33,809,432 | 50.7 | 29,125,448 | 46.6 | 28,844,691 | 48.7 | 29,124,872 | 47.1 |
| 21. Industrial supplies not elsewhere specified, primary | 1,611,398 | 3.0 | 1,689,686 | 2.5 | 1,598,833 | 2.6 | 1,902,722 | 3.2 | 2,524,848 | 4.1 |
| 22. Industrial supplies not elsewhere specified, processed | 26,150,489 | 48.1 | 32,119,746 | 48.1 | 27,526,616 | 44.0 | 26,941,969 | 45.5 | 26,600,024 | 43.1 |
| 3. Fuels and lubricants | 3,994,456 | 7.3 | 7,244,262 | 10.9 | 6,446,898 | 10.3 | 4,711,360 | 8.0 | 5,563,629 | 9.0 |
| 31. Fuels and lubricants, primary | 34,980 | 0.1 | 125,322 | 0.2 | 263,459 | 0.4 | 295,661 | 0.5 | 203,033 | 0.3 |
| 32. Fuels and lubricants, processed | 3,959,477 | 7.3 | 7,118,940 | 10.7 | 6,183,455 | 9.9 | 4,415,699 | 7.5 | 5,360,595 | 8.7 |
| 321. Fuels and lubricants, motor spirit | 3,293,138 | 6.1 | 3,011,671 | 4.5 | 2,436,802 | 3.9 | 1,809,964 | 3.1 | 1,919,246 | 3.1 |
| 322. Fuels and lubricants, other | 666,339 | 1.2 | 4,107,269 | 6.2 | 3,746,653 | 6.0 | 2,631,371 | 4.4 | 3,441,350 | 5.6 |
| 4. Capital goods (except transport equipment), and parts and accessories thereof | 11,640,841 | 21.4 | 14,195,321 | 21.3 | 15,556,094 | 24.9 | 14,871,287 | 25.1 | 14,961,362 | 24.2 |
| 41. Capital goods (except transport equipment) | 8,319,231 | 15.3 | 10,577,094 | 15.8 | 11,601,272 | 18.6 | 10,914,051 | 18.4 | 10,900,384 | 17.6 |
| 42. Capital goods (except transport equipment), parts and accessories | 3,321,611 | 6.1 | 3,618,227 | 5.4 | 3,954,822 | 6.3 | 3,957,236 | 6.7 | 4,060,978 | 6.6 |
| 5. Transport equipment and parts and accessories thereof | 6,531,784 | 12.0 | 6,477,705 | 9.7 | 6,624,140 | 10.6 | 5,560,483 | 9.4 | 6,507,027 | 10.5 |
| 51. Passenger motor vehicles | 2,637,573 | 4.9 | 2,002,689 | 3.0 | 967,432 | 1.5 | 895,247 | 1.5 | 1,080,194 | 1.7 |
| 52. Transport equipment, other than passenger motor vehicles | 2,535,206 | 4.7 | 2,816,288 | 4.2 | 3,628,417 | 5.8 | 2,643,981 | 4.5 | 3,657,128 | 5.9 |
| 521. Transport equipment, other than passenger motor vehicles, industrial | 2,167,694 | 4.0 | 2,233,011 | 3.3 | 3,109,057 | 5.0 | 2,239,266 | 3.8 | 3,287,804 | 5.3 |
| 522. Transport equipment, other than passenger motor vehicles, non-industrial | 367,512 | 0.7 | 583,277 | 0.9 | 519,360 | 0.8 | 404,715 | 0.7 | 369,483 | 0.6 |
| 53. Transport equipment, parts and accessories | 1,359,005 | 2.5 | 1,658,729 | 2.5 | 2,028,291 | 3.2 | 2,021,305 | 3.4 | 1,769,808 | 2.9 |
| 6. Consumer goods not elsewhere specified | 1,938,448 | 3.6 | 2,410,373 | 3.6 | 2,898,794 | 4.6 | 3,291,637 | 5.6 | 3,254,948 | 5.3 |
| 61. Consumer goods not elsewhere specified, durable | 307,575 | 0.6 | 314,147 | 0.5 | 317,242 | 0.5 | 316,661 | 0.5 | 365,728 | 0.6 |
| 62. Consumer goods not elsewhere specified, semi-durable | 743,198 | 1.4 | 962,540 | 1.4 | 946,573 | 1.5 | 915,516 | 1.5 | 1,033,579 | 1.7 |
| 63. Consumer goods not elsewhere specified, non-durable | 887,675 | 1.6 | 1,133,685 | 1.7 | 1,634,979 | 2.6 | 2,059,460 | 3.5 | 1,855,642 | 3.0 |
| 7. Goods not elsewhere specified | 1,291,365 | 2.4 | 1,013,303 | 1.5 | 247,462 | 0.4 | 237,359 | 0.4 | 503,809 | 0.8 |
| All groups | 54,377,155 | 100.0 | 66,734,114 | 100.0 | 62,536,143 | 100.0 | 59,243,225 | 100.0 | 61,780,104 | 100.0 |
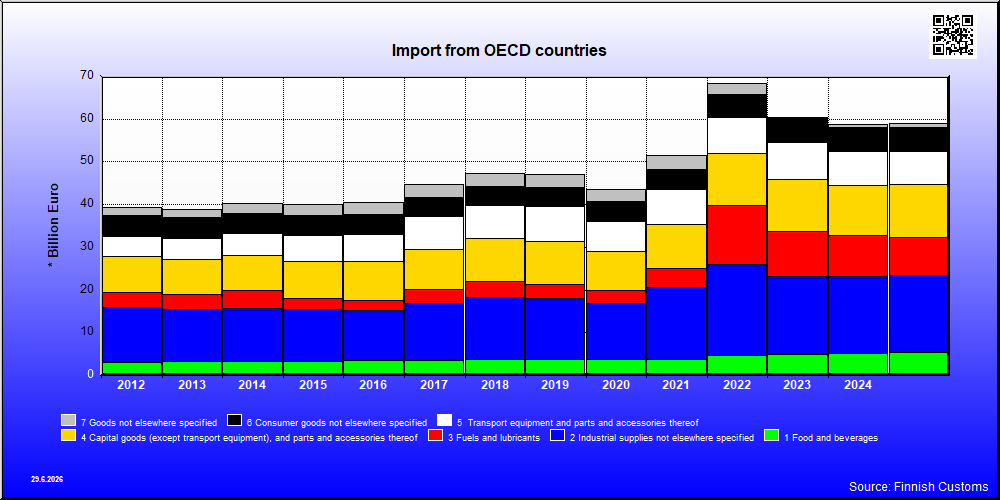
| 2021 | 2022 | 2023 | 2024 | 2025 | ||||||
|---|---|---|---|---|---|---|---|---|---|---|
| 1,000 € | % | 1,000 € | % | 1,000 € | % | 1,000 € | % | 1,000 € | % | |
| 1. Food and beverages | 3,827,611 | 7.4 | 4,601,984 | 6.7 | 4,863,180 | 8.1 | 5,048,091 | 8.6 | 5,287,327 | 9.0 |
| 11. Food and beverages, primary | 1,041,359 | 2.0 | 1,259,287 | 1.8 | 1,117,542 | 1.9 | 1,165,395 | 2.0 | 1,212,135 | 2.1 |
| 111. Food and beverages, primary, mainly for industry | 102,941 | 0.2 | 185,075 | 0.3 | 110,336 | 0.2 | 107,759 | 0.2 | 128,760 | 0.2 |
| 112. Food and beverages, primary, mainly for household consumption | 938,418 | 1.8 | 1,074,211 | 1.6 | 1,007,206 | 1.7 | 1,057,651 | 1.8 | 1,083,375 | 1.8 |
| 12. Food and beverages, processed | 2,786,252 | 5.4 | 3,342,698 | 4.9 | 3,745,638 | 6.2 | 3,882,696 | 6.6 | 4,075,192 | 6.9 |
| 121. Food and beverages, processed, mainly for industry | 157,188 | 0.3 | 205,820 | 0.3 | 236,847 | 0.4 | 308,754 | 0.5 | 356,242 | 0.6 |
| 122. Food and beverages, processed, mainly for household consumption | 2,629,064 | 5.1 | 3,136,878 | 4.6 | 3,508,791 | 5.8 | 3,573,942 | 6.1 | 3,718,951 | 6.3 |
| 2. Industrial supplies not elsewhere specified | 16,878,421 | 32.8 | 21,306,410 | 31.2 | 18,297,273 | 30.3 | 18,119,375 | 30.8 | 18,038,768 | 30.6 |
| 21. Industrial supplies not elsewhere specified, primary | 4,145,347 | 8.1 | 4,794,124 | 7.0 | 3,865,670 | 6.4 | 4,013,451 | 6.8 | 3,785,917 | 6.4 |
| 22. Industrial supplies not elsewhere specified, processed | 12,733,074 | 24.7 | 16,512,286 | 24.2 | 14,431,602 | 23.9 | 14,105,925 | 24.0 | 14,252,851 | 24.2 |
| 3. Fuels and lubricants | 4,317,121 | 8.4 | 13,933,985 | 20.4 | 10,440,759 | 17.3 | 9,574,399 | 16.3 | 8,962,651 | 15.2 |
| 31. Fuels and lubricants, primary | 1,130,348 | 2.2 | 7,713,646 | 11.3 | 6,462,510 | 10.7 | 5,329,455 | 9.1 | 5,307,554 | 9.0 |
| 32. Fuels and lubricants, processed | 3,186,773 | 6.2 | 6,225,256 | 9.1 | 3,978,248 | 6.6 | 4,244,943 | 7.2 | 3,655,097 | 6.2 |
| 321. Fuels and lubricants, motor spirit | 1,824,598 | 3.5 | 796,133 | 1.2 | 744,483 | 1.2 | 757,949 | 1.3 | 443,895 | 0.8 |
| 322. Fuels and lubricants, other | 1,362,175 | 2.6 | 5,429,123 | 8.0 | 3,233,765 | 5.4 | 3,558,494 | 6.0 | 3,211,202 | 5.4 |
| 4. Capital goods (except transport equipment), and parts and accessories thereof | 10,365,771 | 20.1 | 12,217,700 | 17.9 | 12,365,073 | 20.5 | 11,759,929 | 20.0 | 12,530,765 | 21.3 |
| 41. Capital goods (except transport equipment) | 6,154,314 | 12.0 | 7,270,037 | 10.6 | 7,444,910 | 12.3 | 7,236,904 | 12.3 | 7,912,139 | 13.4 |
| 42. Capital goods (except transport equipment), parts and accessories | 4,211,457 | 8.2 | 4,947,663 | 7.2 | 4,920,163 | 8.1 | 4,523,025 | 7.7 | 4,618,626 | 7.8 |
| 5. Transport equipment and parts and accessories thereof | 8,147,135 | 15.8 | 8,431,152 | 12.3 | 8,500,608 | 14.1 | 8,049,290 | 13.7 | 7,552,047 | 12.8 |
| 51. Passenger motor vehicles | 3,110,514 | 6.0 | 3,294,565 | 4.8 | 3,942,686 | 6.5 | 3,402,211 | 5.8 | 3,230,278 | 5.5 |
| 52. Transport equipment, other than passenger motor vehicles | 1,404,598 | 2.7 | 1,560,302 | 2.3 | 1,632,976 | 2.7 | 1,675,969 | 2.8 | 1,459,683 | 2.5 |
| 521. Transport equipment, other than passenger motor vehicles, industrial | 1,123,893 | 2.2 | 1,175,611 | 1.7 | 1,268,149 | 2.1 | 1,413,697 | 2.4 | 1,228,984 | 2.1 |
| 522. Transport equipment, other than passenger motor vehicles, non-industrial | 280,705 | 0.5 | 384,690 | 0.6 | 364,827 | 0.6 | 262,273 | 0.4 | 230,705 | 0.4 |
| 53. Transport equipment, parts and accessories | 3,632,023 | 7.1 | 3,576,286 | 5.2 | 2,924,945 | 4.8 | 2,971,110 | 5.0 | 2,862,087 | 4.9 |
| 6. Consumer goods not elsewhere specified | 4,714,442 | 9.2 | 5,367,398 | 7.9 | 5,633,878 | 9.3 | 5,518,878 | 9.4 | 5,688,102 | 9.6 |
| 61. Consumer goods not elsewhere specified, durable | 1,154,035 | 2.2 | 1,232,430 | 1.8 | 1,237,938 | 2.1 | 1,129,212 | 1.9 | 1,199,393 | 2.0 |
| 62. Consumer goods not elsewhere specified, semi-durable | 1,100,630 | 2.1 | 1,289,213 | 1.9 | 1,338,672 | 2.2 | 1,319,248 | 2.2 | 1,377,065 | 2.3 |
| 63. Consumer goods not elsewhere specified, non-durable | 2,459,777 | 4.8 | 2,845,754 | 4.2 | 3,057,268 | 5.1 | 3,070,418 | 5.2 | 3,111,644 | 5.3 |
| 7. Goods not elsewhere specified | 3,196,531 | 6.2 | 2,437,134 | 3.6 | 269,991 | 0.4 | 785,467 | 1.3 | 892,160 | 1.5 |
| All groups | 51,447,031 | 100.0 | 68,275,336 | 100.0 | 60,370,762 | 100.0 | 58,855,429 | 100.0 | 58,951,820 | 100.0 |
| Classification | Description | Year level | Quarter level | Month level | |
|---|---|---|---|---|---|
| SITC | Standard International Trade Classification (classification system is maintained by the United Nations) | ███ | ███ | ███ | |
| BEC | The standard of statistical classification of BEC (Broad Economic Categories) is upheld by the UN and it is based on SITC-nomenclature. | ███ | ███ | ███ | |
| NACE | National industrial classification based on Statistical Classification of Economic Activities in the European Community Nomenclature générale des Activités économiques dans les Communautés européennes | ███ | ███ | ███ | |
| CPA | CPA = Classification of Products by Activities | ███ | ███ | ███ | |
| CN | The Combined Nomenclature is the common nomenclature of the European Community. | ███ | ███ | ███ |