
| Export of goods from Finland and import to Finland | Trade Balance |
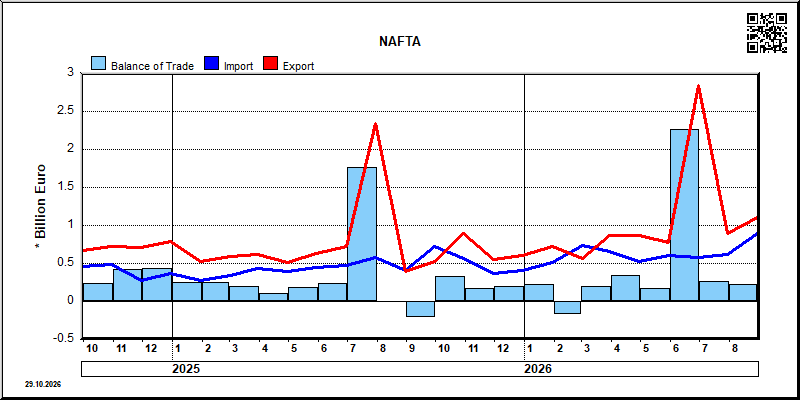
| Year | Month | Import 1,000 € | Export 1,000 € | Trade 1,000 € | Trade Balance 1,000 € |
|---|---|---|---|---|---|
| 2023 | 1 | 416,619 | 649,485 | 1,066,104 | 232,865 |
| 2023 | 2 | 269,642 | 570,274 | 839,917 | 300,632 |
| 2023 | 3 | 424,891 | 656,230 | 1,081,121 | 231,339 |
| 2023 | 4 | 411,686 | 623,760 | 1,035,446 | 212,074 |
| 2023 | 5 | 509,973 | 825,367 | 1,335,340 | 315,394 |
| 2023 | 6 | 492,762 | 681,132 | 1,173,894 | 188,370 |
| 2023 | 7 | 402,958 | 668,101 | 1,071,059 | 265,144 |
| 2023 | 8 | 422,501 | 677,690 | 1,100,191 | 255,189 |
| 2023 | 9 | 383,848 | 791,376 | 1,175,225 | 407,528 |
| 2023 | 10 | 355,524 | 756,550 | 1,112,074 | 401,026 |
| 2023 | 11 | 484,992 | 2,564,770 | 3,049,761 | 2,079,778 |
| 2023 | 12 | 387,711 | 605,889 | 993,599 | 218,178 |
| 2024 | 1 | 413,696 | 690,723 | 1,104,419 | 277,027 |
| 2024 | 2 | 453,330 | 617,761 | 1,071,091 | 164,431 |
| 2024 | 3 | 306,473 | 420,757 | 727,230 | 114,284 |
| 2024 | 4 | 439,163 | 706,322 | 1,145,485 | 267,158 |
| 2024 | 5 | 277,356 | 725,255 | 1,002,611 | 447,899 |
| 2024 | 6 | 363,876 | 757,279 | 1,121,155 | 393,403 |
| 2024 | 7 | 533,717 | 883,105 | 1,416,822 | 349,388 |
| 2024 | 8 | 381,165 | 627,148 | 1,008,313 | 245,984 |
| 2024 | 9 | 456,813 | 675,092 | 1,131,905 | 218,279 |
| 2024 | 10 | 491,234 | 725,229 | 1,216,463 | 233,995 |
| 2024 | 11 | 279,732 | 706,624 | 986,356 | 426,893 |
| 2024 | 12 | 364,173 | 794,059 | 1,158,232 | 429,886 |
| 2025 | 1 | 273,097 | 524,976 | 798,073 | 251,880 |
| 2025 | 2 | 340,827 | 591,312 | 932,139 | 250,485 |
| 2025 | 3 | 427,940 | 620,052 | 1,047,992 | 192,112 |
| 2025 | 4 | 400,636 | 511,505 | 912,141 | 110,869 |
| 2025 | 5 | 448,271 | 629,273 | 1,077,544 | 181,003 |
| 2025 | 6 | 478,937 | 720,000 | 1,198,937 | 241,063 |
| 2025 | 7 | 577,413 | 2,343,719 | 2,921,133 | 1,766,306 |
| 2025 | 8 | 408,039 | 398,134 | 806,173 | -9,905 |
| 2025 | 9 | 727,143 | 521,908 | 1,249,052 | -205,235 |
| 2025 | 10 | 565,282 | 892,768 | 1,458,050 | 327,485 |
| 2025 | 11 | 372,265 | 548,127 | 920,393 | 175,862 |
| 2025 | 12 | 405,827 | 606,917 | 1,012,744 | 201,090 |
| 2026 | 1 | 507,143 | 728,125 | 1,235,269 | 220,982 |
| 2026 | 2 | 736,661 | 560,053 | 1,296,713 | -176,608 |
| 2026 | 3 | 662,089 | 862,710 | 1,524,799 | 200,621 |
| 2026 | 4 | 525,879 | 872,629 | 1,398,508 | 346,751 |
| 2026 | 5 | 603,060 | 777,255 | 1,380,314 | 174,195 |
| 2026 | 6 | 577,292 | 2,839,411 | 3,416,703 | 2,262,119 |
| 2026 | 7 | 620,813 | 888,474 | 1,509,287 | 267,661 |

| 2026/3 | 2026/4 | 2026/5 | 2026/6 | 2026/7 | ||||||
|---|---|---|---|---|---|---|---|---|---|---|
| 1000 € | % | 1000 € | % | 1000 € | % | 1000 € | % | 1000 € | % | |
| 0. Food and live animals | 2,780 | 0.3 | 2,733 | 0.3 | 2,408 | 0.3 | 2,840 | 0.1 | 3,112 | 0.4 |
| 1. Beverages and tobacco | 583 | 0.1 | 363 | 0.0 | 511 | 0.1 | 469 | 0.0 | 512 | 0.1 |
| 2. Crude materials,inedible,except fuels | 29,932 | 3.5 | 34,837 | 4.0 | 28,040 | 3.6 | 18,502 | 0.7 | 21,168 | 2.4 |
| 3. Mineral fuels etc | 34,274 | 4.0 | 37,720 | 4.3 | 78,536 | 10.1 | 137,214 | 4.8 | 159 | 0.0 |
| 4. Animal and vegetable oils and fats | 148 | 0.0 | 12 | 0.0 | 59 | 0.0 | 137 | 0.0 | ||
| 5. Chemicals and related products,n.e.s. | 222,051 | 25.7 | 247,342 | 28.3 | 145,969 | 18.8 | 282,873 | 10.0 | 227,952 | 25.7 |
| 6. Basic manufactures | 162,077 | 18.8 | 151,005 | 17.3 | 151,634 | 19.5 | 171,322 | 6.0 | 190,833 | 21.5 |
| 7. Machinery,transport equipment | 235,016 | 27.2 | 264,049 | 30.3 | 238,686 | 30.7 | 2,161,578 | 76.1 | 356,294 | 40.1 |
| 8. Miscellaneous manufactured articles | 175,843 | 20.4 | 134,568 | 15.4 | 131,407 | 16.9 | 64,614 | 2.3 | 88,307 | 9.9 |
| 9. Goods not classified elsewhere | 6 | 0.0 | 4 | 0.0 | 1 | 0.0 | ||||
| All groups combined | 862,710 | 100.0 | 872,629 | 100.0 | 777,255 | 100.0 | 2,839,411 | 100.0 | 888,474 | 100.0 |

| 2026/3 | 2026/4 | 2026/5 | 2026/6 | 2026/7 | ||||||
|---|---|---|---|---|---|---|---|---|---|---|
| 1000 € | % | 1000 € | % | 1000 € | % | 1000 € | % | 1000 € | % | |
| 0. Food and live animals | 4,900 | 0.7 | 5,947 | 1.1 | 4,123 | 0.7 | 5,351 | 0.9 | 4,670 | 0.8 |
| 1. Beverages and tobacco | 1,235 | 0.2 | 1,524 | 0.3 | 1,271 | 0.2 | 1,772 | 0.3 | 1,690 | 0.3 |
| 2. Crude materials,inedible,except fuels | 33,360 | 5.0 | 15,911 | 3.0 | 8,609 | 1.4 | 7,576 | 1.3 | 87,816 | 14.1 |
| 3. Mineral fuels etc | 53,747 | 8.1 | 158,094 | 30.1 | 181,501 | 30.1 | 213,798 | 37.0 | 131,309 | 21.2 |
| 4. Animal and vegetable oils and fats | 21 | 0.0 | 158 | 0.0 | 39 | 0.0 | 30 | 0.0 | 92 | 0.0 |
| 5. Chemicals and related products,n.e.s. | 78,109 | 11.8 | 86,371 | 16.4 | 109,790 | 18.2 | 109,583 | 19.0 | 129,794 | 20.9 |
| 6. Basic manufactures | 25,987 | 3.9 | 44,703 | 8.5 | 29,274 | 4.9 | 39,771 | 6.9 | 31,558 | 5.1 |
| 7. Machinery,transport equipment | 415,185 | 62.7 | 167,035 | 31.8 | 212,326 | 35.2 | 151,859 | 26.3 | 196,146 | 31.6 |
| 8. Miscellaneous manufactured articles | 48,282 | 7.3 | 44,961 | 8.5 | 55,100 | 9.1 | 46,456 | 8.0 | 36,743 | 5.9 |
| 9. Goods not classified elsewhere | 1,263 | 0.2 | 1,175 | 0.2 | 1,028 | 0.2 | 1,096 | 0.2 | 996 | 0.2 |
| All groups combined | 662,089 | 100.0 | 525,879 | 100.0 | 603,060 | 100.0 | 577,292 | 100.0 | 620,813 | 100.0 |
| Classification | Description | Year level | Quarter level | Month level | Year 2026 sofar |
|---|---|---|---|---|---|
| SITC | Standard International Trade Classification (classification system is maintained by the United Nations) | ███ | ███ | ███ | ███ |
| BEC | The standard of statistical classification of BEC (Broad Economic Categories) is upheld by the UN and it is based on SITC-nomenclature. | ███ | ███ | ███ | ███ |
| NACE | National industrial classification based on Statistical Classification of Economic Activities in the European Community Nomenclature générale des Activités économiques dans les Communautés européennes | ███ | ███ | ███ | ███ |
| CPA | CPA = Classification of Products by Activities | ███ | ███ | ███ | ███ |
| CN | The Combined Nomenclature is the common nomenclature of the European Community. | ███ | ███ | ███ | ███ |