
| Export of goods from Finland and import to Finland | BEC (Broad Economic Categories) |
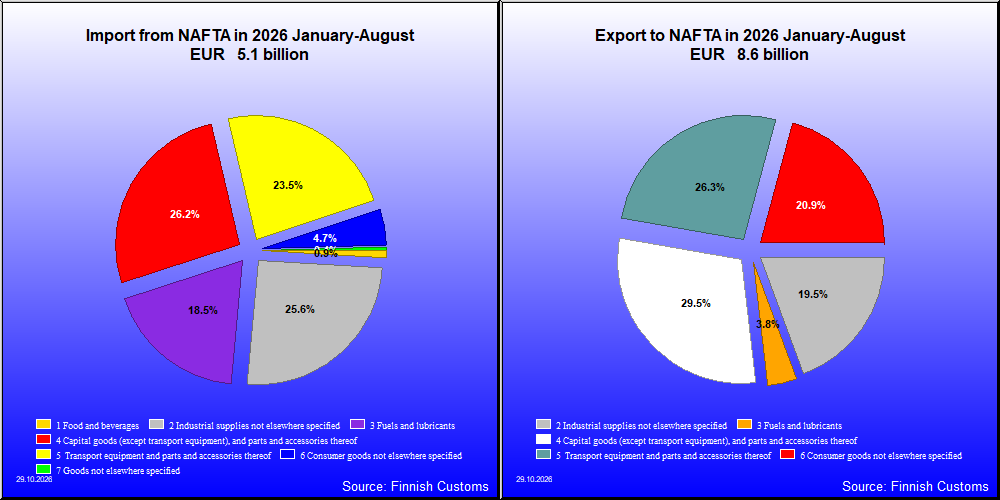
| 2026 1-8 1,000 € | 2025 1-8 1,000 € | Change % |
|
|---|---|---|---|
| 1. Food and beverages | 25,603 | 24,046 | 6.5 |
| 11. Food and beverages, primary | 1,867 | 1,779 | 5.0 |
| 111. Food and beverages, primary, mainly for industry | 9 | 18 | -49.4 |
| 112. Food and beverages, primary, mainly for household consumption | 1,858 | 1,761 | 5.5 |
| 12. Food and beverages, processed | 23,735 | 22,267 | 6.6 |
| 121. Food and beverages, processed, mainly for industry | 3,813 | 1,502 | 153.8 |
| 122. Food and beverages, processed, mainly for household consumption | 19,923 | 20,765 | -4.1 |
| 2. Industrial supplies not elsewhere specified | 1,673,249 | 1,699,659 | -1.6 |
| 21. Industrial supplies not elsewhere specified, primary | 17,087 | 71,441 | -76.1 |
| 22. Industrial supplies not elsewhere specified, processed | 1,656,162 | 1,628,217 | 1.7 |
| 3. Fuels and lubricants | 324,428 | 146,864 | 120.9 |
| 31. Fuels and lubricants, primary | 1,860 | 2,396 | -22.4 |
| 32. Fuels and lubricants, processed | 322,568 | 144,468 | 123.3 |
| 321. Fuels and lubricants, motor spirit | 322,112 | 143,705 | 124.1 |
| 322. Fuels and lubricants, other | 456 | 763 | -40.3 |
| 4. Capital goods (except transport equipment), and parts and accessories thereof | 2,540,165 | 2,258,524 | 12.5 |
| 41. Capital goods (except transport equipment) | 1,938,149 | 1,751,376 | 10.7 |
| 42. Capital goods (except transport equipment), parts and accessories | 602,017 | 507,147 | 18.7 |
| 5. Transport equipment and parts and accessories thereof | 2,264,178 | 2,058,892 | 10.0 |
| 51. Passenger motor vehicles | 145 | 601 | -75.9 |
| 52. Transport equipment, other than passenger motor vehicles | 2,115,810 | 1,926,986 | 9.8 |
| 521. Transport equipment, other than passenger motor vehicles, industrial | 2,082,431 | 1,902,752 | 9.4 |
| 522. Transport equipment, other than passenger motor vehicles, non-industrial | 33,379 | 24,234 | 37.7 |
| 53. Transport equipment, parts and accessories | 148,223 | 131,304 | 12.9 |
| 6. Consumer goods not elsewhere specified | 1,797,498 | 130,002 | .. |
| 61. Consumer goods not elsewhere specified, durable | 57,611 | 55,209 | 4.4 |
| 62. Consumer goods not elsewhere specified, semi-durable | 48,181 | 51,252 | -6.0 |
| 63. Consumer goods not elsewhere specified, non-durable | 1,691,706 | 23,542 | .. |
| 7. Goods not elsewhere specified | 8,644 | 7,097 | 21.8 |
| All groups | 8,633,765 | 6,325,084 | 36.5 |
| 2026 1-8 1,000 € | 2025 1-8 1,000 € | Change % |
|
|---|---|---|---|
| 1. Food and beverages | 48,351 | 43,864 | 10.2 |
| 11. Food and beverages, primary | 19,272 | 14,974 | 28.7 |
| 111. Food and beverages, primary, mainly for industry | 7,522 | 6,037 | 24.6 |
| 112. Food and beverages, primary, mainly for household consumption | 11,750 | 8,937 | 31.5 |
| 12. Food and beverages, processed | 29,079 | 28,890 | 0.7 |
| 121. Food and beverages, processed, mainly for industry | 1,269 | 502 | 152.8 |
| 122. Food and beverages, processed, mainly for household consumption | 27,809 | 28,388 | -2.0 |
| 2. Industrial supplies not elsewhere specified | 1,311,771 | 977,178 | 34.2 |
| 21. Industrial supplies not elsewhere specified, primary | 347,822 | 177,558 | 95.9 |
| 22. Industrial supplies not elsewhere specified, processed | 963,948 | 799,619 | 20.6 |
| 3. Fuels and lubricants | 949,339 | 885,571 | 7.2 |
| 31. Fuels and lubricants, primary | 563,507 | 512,429 | 10.0 |
| 32. Fuels and lubricants, processed | 385,831 | 373,141 | 3.4 |
| 321. Fuels and lubricants, motor spirit | 35 | 22 | 57.0 |
| 322. Fuels and lubricants, other | 385,797 | 373,119 | 3.4 |
| 4. Capital goods (except transport equipment), and parts and accessories thereof | 1,344,757 | 953,813 | 41.0 |
| 41. Capital goods (except transport equipment) | 1,079,194 | 778,264 | 38.7 |
| 42. Capital goods (except transport equipment), parts and accessories | 265,563 | 175,549 | 51.3 |
| 5. Transport equipment and parts and accessories thereof | 1,204,430 | 268,334 | 348.9 |
| 51. Passenger motor vehicles | 38,301 | 56,056 | -31.7 |
| 52. Transport equipment, other than passenger motor vehicles | 926,465 | 42,850 | .. |
| 521. Transport equipment, other than passenger motor vehicles, industrial | 905,964 | 24,389 | .. |
| 522. Transport equipment, other than passenger motor vehicles, non-industrial | 20,501 | 18,461 | 11.1 |
| 53. Transport equipment, parts and accessories | 239,664 | 169,428 | 41.5 |
| 6. Consumer goods not elsewhere specified | 242,067 | 191,571 | 26.4 |
| 61. Consumer goods not elsewhere specified, durable | 69,949 | 60,350 | 15.9 |
| 62. Consumer goods not elsewhere specified, semi-durable | 41,413 | 37,701 | 9.8 |
| 63. Consumer goods not elsewhere specified, non-durable | 130,705 | 93,519 | 39.8 |
| 7. Goods not elsewhere specified | 23,029 | 16,219 | 42.0 |
| All groups | 5,123,742 | 3,336,548 | 53.6 |
| Classification | Description | Year level | Quarter level | Month level | Year 2026 sofar |
|---|---|---|---|---|---|
| SITC | Standard International Trade Classification (classification system is maintained by the United Nations) | ███ | ███ | ███ | ███ |
| BEC | The standard of statistical classification of BEC (Broad Economic Categories) is upheld by the UN and it is based on SITC-nomenclature. | ███ | ███ | ███ | ███ |
| NACE | National industrial classification based on Statistical Classification of Economic Activities in the European Community Nomenclature générale des Activités économiques dans les Communautés européennes | ███ | ███ | ███ | ███ |
| CPA | CPA = Classification of Products by Activities | ███ | ███ | ███ | ███ |
| CN | The Combined Nomenclature is the common nomenclature of the European Community. | ███ | ███ | ███ | ███ |