
| Export of goods from Finland and import to Finland | BEC (Broad Economic Categories) |
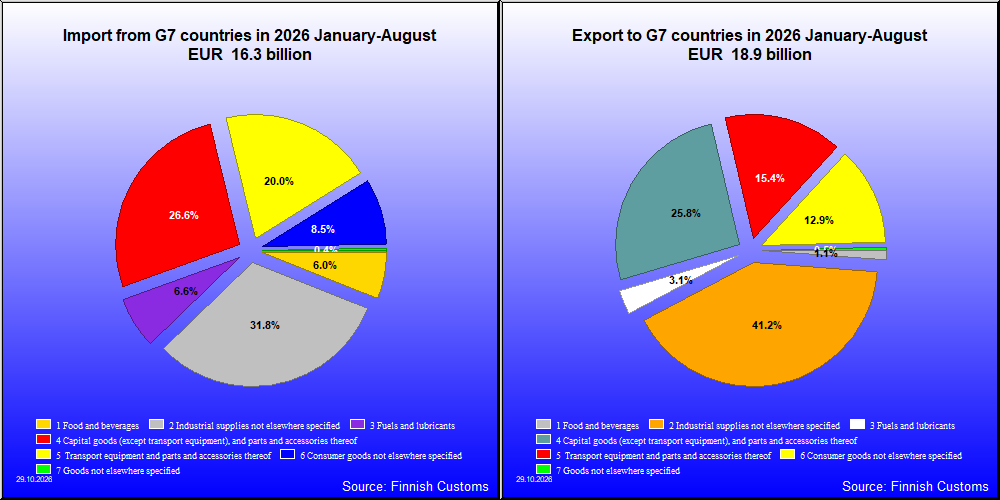
| 2026 1-8 1,000 € | 2025 1-8 1,000 € | Change % |
|
|---|---|---|---|
| 1. Food and beverages | 208,622 | 231,986 | -10.1 |
| 11. Food and beverages, primary | 60,336 | 51,181 | 17.9 |
| 111. Food and beverages, primary, mainly for industry | 2,907 | 3,637 | -20.1 |
| 112. Food and beverages, primary, mainly for household consumption | 57,429 | 47,544 | 20.8 |
| 12. Food and beverages, processed | 148,285 | 180,805 | -18.0 |
| 121. Food and beverages, processed, mainly for industry | 33,724 | 31,656 | 6.5 |
| 122. Food and beverages, processed, mainly for household consumption | 114,561 | 149,149 | -23.2 |
| 2. Industrial supplies not elsewhere specified | 7,775,424 | 7,108,294 | 9.4 |
| 21. Industrial supplies not elsewhere specified, primary | 260,722 | 261,374 | -0.2 |
| 22. Industrial supplies not elsewhere specified, processed | 7,514,703 | 6,846,921 | 9.8 |
| 3. Fuels and lubricants | 593,717 | 471,196 | 26.0 |
| 31. Fuels and lubricants, primary | 19,222 | 8,107 | 137.1 |
| 32. Fuels and lubricants, processed | 574,496 | 463,089 | 24.1 |
| 321. Fuels and lubricants, motor spirit | 404,505 | 373,964 | 8.2 |
| 322. Fuels and lubricants, other | 169,991 | 89,125 | 90.7 |
| 4. Capital goods (except transport equipment), and parts and accessories thereof | 4,869,987 | 4,516,042 | 7.8 |
| 41. Capital goods (except transport equipment) | 3,737,939 | 3,515,074 | 6.3 |
| 42. Capital goods (except transport equipment), parts and accessories | 1,132,048 | 1,000,968 | 13.1 |
| 5. Transport equipment and parts and accessories thereof | 2,905,369 | 3,214,395 | -9.6 |
| 51. Passenger motor vehicles | 5,915 | 506,090 | -98.8 |
| 52. Transport equipment, other than passenger motor vehicles | 2,227,295 | 2,068,824 | 7.7 |
| 521. Transport equipment, other than passenger motor vehicles, industrial | 2,159,349 | 1,978,113 | 9.2 |
| 522. Transport equipment, other than passenger motor vehicles, non-industrial | 67,946 | 90,711 | -25.1 |
| 53. Transport equipment, parts and accessories | 672,159 | 639,481 | 5.1 |
| 6. Consumer goods not elsewhere specified | 2,425,411 | 584,010 | 315.3 |
| 61. Consumer goods not elsewhere specified, durable | 100,146 | 92,713 | 8.0 |
| 62. Consumer goods not elsewhere specified, semi-durable | 203,688 | 196,814 | 3.5 |
| 63. Consumer goods not elsewhere specified, non-durable | 2,121,577 | 294,483 | 620.4 |
| 7. Goods not elsewhere specified | 89,519 | 80,408 | 11.3 |
| All groups | 18,868,049 | 16,206,331 | 16.4 |
| 2026 1-8 1,000 € | 2025 1-8 1,000 € | Change % |
|
|---|---|---|---|
| 1. Food and beverages | 980,874 | 1,011,475 | -3.0 |
| 11. Food and beverages, primary | 123,611 | 112,481 | 9.9 |
| 111. Food and beverages, primary, mainly for industry | 27,210 | 18,324 | 48.5 |
| 112. Food and beverages, primary, mainly for household consumption | 96,401 | 94,157 | 2.4 |
| 12. Food and beverages, processed | 857,263 | 898,994 | -4.6 |
| 121. Food and beverages, processed, mainly for industry | 63,554 | 90,602 | -29.9 |
| 122. Food and beverages, processed, mainly for household consumption | 793,709 | 808,391 | -1.8 |
| 2. Industrial supplies not elsewhere specified | 5,175,860 | 4,371,001 | 18.4 |
| 21. Industrial supplies not elsewhere specified, primary | 714,469 | 546,188 | 30.8 |
| 22. Industrial supplies not elsewhere specified, processed | 4,461,391 | 3,824,813 | 16.6 |
| 3. Fuels and lubricants | 1,080,469 | 1,071,017 | 0.9 |
| 31. Fuels and lubricants, primary | 563,560 | 569,929 | -1.1 |
| 32. Fuels and lubricants, processed | 516,910 | 501,088 | 3.2 |
| 321. Fuels and lubricants, motor spirit | 215 | 243 | -11.3 |
| 322. Fuels and lubricants, other | 516,694 | 500,845 | 3.2 |
| 4. Capital goods (except transport equipment), and parts and accessories thereof | 4,325,565 | 3,628,120 | 19.2 |
| 41. Capital goods (except transport equipment) | 2,782,054 | 2,253,466 | 23.5 |
| 42. Capital goods (except transport equipment), parts and accessories | 1,543,511 | 1,374,654 | 12.3 |
| 5. Transport equipment and parts and accessories thereof | 3,245,987 | 2,631,183 | 23.4 |
| 51. Passenger motor vehicles | 1,120,128 | 1,237,334 | -9.5 |
| 52. Transport equipment, other than passenger motor vehicles | 1,151,762 | 315,348 | 265.2 |
| 521. Transport equipment, other than passenger motor vehicles, industrial | 1,076,954 | 252,836 | 325.9 |
| 522. Transport equipment, other than passenger motor vehicles, non-industrial | 74,808 | 62,512 | 19.7 |
| 53. Transport equipment, parts and accessories | 974,097 | 1,078,502 | -9.7 |
| 6. Consumer goods not elsewhere specified | 1,383,289 | 1,239,651 | 11.6 |
| 61. Consumer goods not elsewhere specified, durable | 217,401 | 204,838 | 6.1 |
| 62. Consumer goods not elsewhere specified, semi-durable | 295,834 | 295,191 | 0.2 |
| 63. Consumer goods not elsewhere specified, non-durable | 870,054 | 739,622 | 17.6 |
| 7. Goods not elsewhere specified | 71,258 | 187,251 | -61.9 |
| All groups | 16,263,303 | 14,139,699 | 15.0 |
| Classification | Description | Year level | Quarter level | Month level | Year 2026 sofar |
|---|---|---|---|---|---|
| SITC | Standard International Trade Classification (classification system is maintained by the United Nations) | ███ | ███ | ███ | ███ |
| BEC | The standard of statistical classification of BEC (Broad Economic Categories) is upheld by the UN and it is based on SITC-nomenclature. | ███ | ███ | ███ | ███ |
| NACE | National industrial classification based on Statistical Classification of Economic Activities in the European Community Nomenclature générale des Activités économiques dans les Communautés européennes | ███ | ███ | ███ | ███ |
| CPA | CPA = Classification of Products by Activities | ███ | ███ | ███ | ███ |
| CN | The Combined Nomenclature is the common nomenclature of the European Community. | ███ | ███ | ███ | ███ |