
| Export of goods from Finland and import to Finland | BEC (Broad Economic Categories) |
*) The standard of statistical classification of BEC (Broad Economic Categories) is upheld by the UN and it is based on SITC-nomenclature.

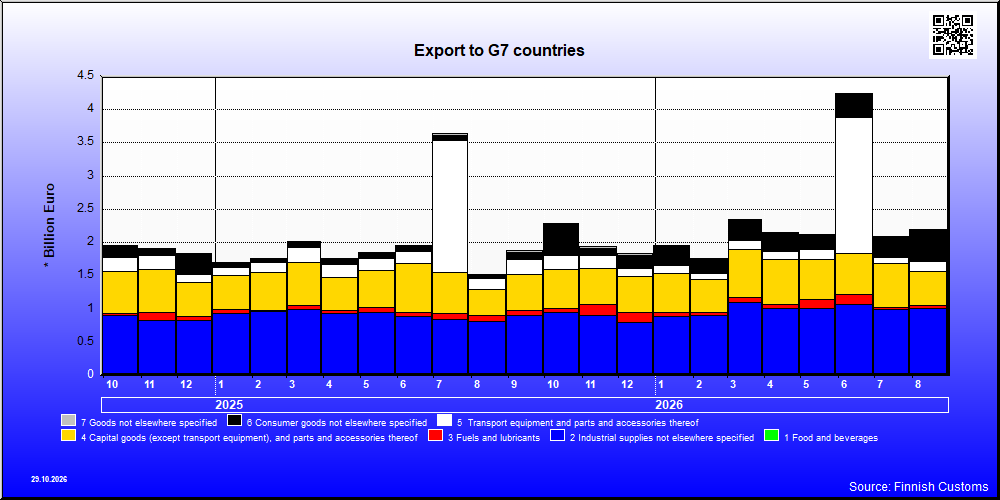
| 8 / 2026 | 8 / 2025 | Change from previous year's equal month % | ||
|---|---|---|---|---|
| 1,000 € | % | 1000 € | ||
| 1. Food and beverages | 23,102 | 1.0 | 31,229 | -26.0 |
| 11. Food and beverages, primary | 6,301 | 0.3 | 8,722 | -27.8 |
| 111. Food and beverages, primary, mainly for industry | 162 | 0.0 | 2,154 | -92.5 |
| 112. Food and beverages, primary, mainly for household consumption | 6,139 | 0.3 | 6,568 | -6.5 |
| 12. Food and beverages, processed | 16,800 | 0.8 | 22,508 | -25.4 |
| 121. Food and beverages, processed, mainly for industry | 3,713 | 0.2 | 4,859 | -23.6 |
| 122. Food and beverages, processed, mainly for household consumption | 13,087 | 0.6 | 17,648 | -25.8 |
| 2. Industrial supplies not elsewhere specified | 987,211 | 44.9 | 781,906 | 26.3 |
| 21. Industrial supplies not elsewhere specified, primary | 22,950 | 1.0 | 39,433 | -41.8 |
| 22. Industrial supplies not elsewhere specified, processed | 964,262 | 43.8 | 742,473 | 29.9 |
| 3. Fuels and lubricants | 49,050 | 2.2 | 87,101 | -43.7 |
| 31. Fuels and lubricants, primary | 604 | 0.0 | 593 | 1.9 |
| 32. Fuels and lubricants, processed | 48,446 | 2.2 | 86,508 | -44.0 |
| 321. Fuels and lubricants, motor spirit | 35,665 | 1.6 | 80,243 | -55.6 |
| 322. Fuels and lubricants, other | 12,781 | 0.6 | 6,265 | 104.0 |
| 4. Capital goods (except transport equipment), and parts and accessories thereof | 501,085 | 22.8 | 398,489 | 25.7 |
| 41. Capital goods (except transport equipment) | 368,268 | 16.7 | 292,822 | 25.8 |
| 42. Capital goods (except transport equipment), parts and accessories | 132,817 | 6.0 | 105,667 | 25.7 |
| 5. Transport equipment and parts and accessories thereof | 149,881 | 6.8 | 166,563 | -10.0 |
| 51. Passenger motor vehicles | 277 | 0.0 | 83,415 | -99.7 |
| 52. Transport equipment, other than passenger motor vehicles | 91,401 | 4.2 | 18,948 | 382.4 |
| 521. Transport equipment, other than passenger motor vehicles, industrial | 88,165 | 4.0 | 13,815 | 538.2 |
| 522. Transport equipment, other than passenger motor vehicles, non-industrial | 3,236 | 0.1 | 5,134 | -37.0 |
| 53. Transport equipment, parts and accessories | 58,202 | 2.6 | 64,199 | -9.3 |
| 6. Consumer goods not elsewhere specified | 482,645 | 21.9 | 46,111 | 946.7 |
| 61. Consumer goods not elsewhere specified, durable | 10,902 | 0.5 | 7,514 | 45.1 |
| 62. Consumer goods not elsewhere specified, semi-durable | 25,566 | 1.2 | 23,126 | 10.6 |
| 63. Consumer goods not elsewhere specified, non-durable | 446,176 | 20.3 | 15,471 | .. |
| 7. Goods not elsewhere specified | 8,093 | 0.4 | 6,898 | 17.3 |
| All groups | 2,201,066 | 100.0 | 1,518,296 | 45.0 |
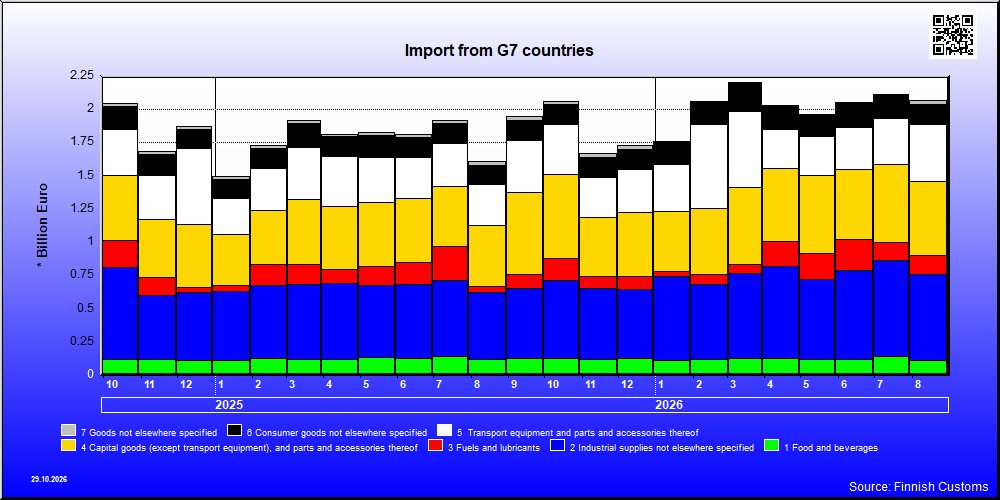
| 8 / 2026 | 8 / 2025 | Change from previous year's equal month % | ||
|---|---|---|---|---|
| 1,000 € | % | 1,000 € | ||
| 1. Food and beverages | 110,695 | 5.3 | 120,941 | -8.5 |
| 11. Food and beverages, primary | 12,862 | 0.6 | 11,866 | 8.4 |
| 111. Food and beverages, primary, mainly for industry | 1,719 | 0.1 | 658 | 161.2 |
| 112. Food and beverages, primary, mainly for household consumption | 11,143 | 0.5 | 11,207 | -0.6 |
| 12. Food and beverages, processed | 97,833 | 4.7 | 109,076 | -10.3 |
| 121. Food and beverages, processed, mainly for industry | 6,668 | 0.3 | 9,450 | -29.4 |
| 122. Food and beverages, processed, mainly for household consumption | 91,165 | 4.4 | 99,626 | -8.5 |
| 2. Industrial supplies not elsewhere specified | 651,011 | 31.5 | 506,147 | 28.6 |
| 21. Industrial supplies not elsewhere specified, primary | 123,626 | 6.0 | 54,978 | 124.9 |
| 22. Industrial supplies not elsewhere specified, processed | 527,385 | 25.5 | 451,169 | 16.9 |
| 3. Fuels and lubricants | 144,178 | 7.0 | 42,286 | 241.0 |
| 31. Fuels and lubricants, primary | 15,306 | 0.7 | 15,493 | -1.2 |
| 32. Fuels and lubricants, processed | 128,872 | 6.2 | 26,793 | 381.0 |
| 321. Fuels and lubricants, motor spirit | 4 | 0.0 | 115 | -96.2 |
| 322. Fuels and lubricants, other | 128,868 | 6.2 | 26,678 | 383.1 |
| 4. Capital goods (except transport equipment), and parts and accessories thereof | 556,102 | 26.9 | 458,446 | 21.3 |
| 41. Capital goods (except transport equipment) | 374,096 | 18.1 | 292,970 | 27.7 |
| 42. Capital goods (except transport equipment), parts and accessories | 182,006 | 8.8 | 165,476 | 10.0 |
| 5. Transport equipment and parts and accessories thereof | 429,511 | 20.8 | 306,550 | 40.1 |
| 51. Passenger motor vehicles | 123,596 | 6.0 | 121,656 | 1.6 |
| 52. Transport equipment, other than passenger motor vehicles | 176,821 | 8.5 | 44,459 | 297.7 |
| 521. Transport equipment, other than passenger motor vehicles, industrial | 171,008 | 8.3 | 39,272 | 335.4 |
| 522. Transport equipment, other than passenger motor vehicles, non-industrial | 5,813 | 0.3 | 5,187 | 12.1 |
| 53. Transport equipment, parts and accessories | 129,094 | 6.2 | 140,435 | -8.1 |
| 6. Consumer goods not elsewhere specified | 150,913 | 7.3 | 148,722 | 1.5 |
| 61. Consumer goods not elsewhere specified, durable | 24,161 | 1.2 | 23,317 | 3.6 |
| 62. Consumer goods not elsewhere specified, semi-durable | 30,945 | 1.5 | 36,138 | -14.4 |
| 63. Consumer goods not elsewhere specified, non-durable | 95,807 | 4.6 | 89,267 | 7.3 |
| 7. Goods not elsewhere specified | 27,301 | 1.3 | 24,727 | 10.4 |
| All groups | 2,069,710 | 100.0 | 1,607,818 | 28.7 |
| Classification | Description | Year level | Quarter level | Month level | Year 2026 sofar |
|---|---|---|---|---|---|
| SITC | Standard International Trade Classification (classification system is maintained by the United Nations) | ███ | ███ | ███ | ███ |
| BEC | The standard of statistical classification of BEC (Broad Economic Categories) is upheld by the UN and it is based on SITC-nomenclature. | ███ | ███ | ███ | ███ |
| NACE | National industrial classification based on Statistical Classification of Economic Activities in the European Community Nomenclature générale des Activités économiques dans les Communautés européennes | ███ | ███ | ███ | ███ |
| CPA | CPA = Classification of Products by Activities | ███ | ███ | ███ | ███ |
| CN | The Combined Nomenclature is the common nomenclature of the European Community. | ███ | ███ | ███ | ███ |