
| Export of goods from Finland and import to Finland | BEC (Broad Economic Categories) |
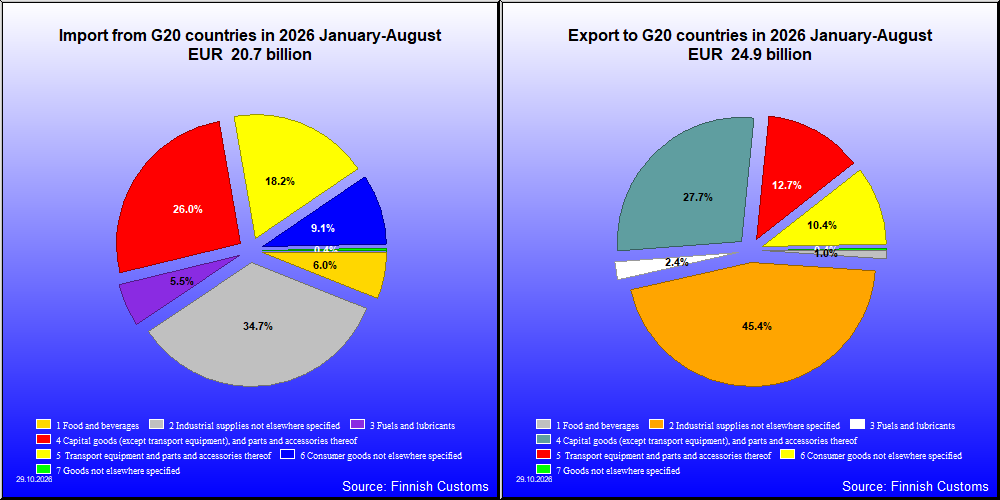
| 2026 1-8 1,000 € | 2025 1-8 1,000 € | Change % |
|
|---|---|---|---|
| 1. Food and beverages | 260,772 | 281,650 | -7.4 |
| 11. Food and beverages, primary | 62,315 | 53,458 | 16.6 |
| 111. Food and beverages, primary, mainly for industry | 2,964 | 3,643 | -18.6 |
| 112. Food and beverages, primary, mainly for household consumption | 59,351 | 49,815 | 19.1 |
| 12. Food and beverages, processed | 198,457 | 228,193 | -13.0 |
| 121. Food and beverages, processed, mainly for industry | 43,160 | 39,999 | 7.9 |
| 122. Food and beverages, processed, mainly for household consumption | 155,296 | 188,193 | -17.5 |
| 2. Industrial supplies not elsewhere specified | 11,292,059 | 10,021,461 | 12.7 |
| 21. Industrial supplies not elsewhere specified, primary | 977,750 | 833,126 | 17.4 |
| 22. Industrial supplies not elsewhere specified, processed | 10,314,309 | 9,188,336 | 12.3 |
| 3. Fuels and lubricants | 603,439 | 477,100 | 26.5 |
| 31. Fuels and lubricants, primary | 26,583 | 13,261 | 100.5 |
| 32. Fuels and lubricants, processed | 576,856 | 463,839 | 24.4 |
| 321. Fuels and lubricants, motor spirit | 404,505 | 373,964 | 8.2 |
| 322. Fuels and lubricants, other | 172,351 | 89,876 | 91.8 |
| 4. Capital goods (except transport equipment), and parts and accessories thereof | 6,876,520 | 6,234,648 | 10.3 |
| 41. Capital goods (except transport equipment) | 5,135,956 | 4,666,017 | 10.1 |
| 42. Capital goods (except transport equipment), parts and accessories | 1,740,564 | 1,568,631 | 11.0 |
| 5. Transport equipment and parts and accessories thereof | 3,148,762 | 3,678,027 | -14.4 |
| 51. Passenger motor vehicles | 6,625 | 507,378 | -98.7 |
| 52. Transport equipment, other than passenger motor vehicles | 2,419,212 | 2,467,590 | -2.0 |
| 521. Transport equipment, other than passenger motor vehicles, industrial | 2,335,609 | 2,365,885 | -1.3 |
| 522. Transport equipment, other than passenger motor vehicles, non-industrial | 83,602 | 101,824 | -17.9 |
| 53. Transport equipment, parts and accessories | 722,925 | 703,059 | 2.8 |
| 6. Consumer goods not elsewhere specified | 2,574,849 | 666,857 | 286.1 |
| 61. Consumer goods not elsewhere specified, durable | 116,221 | 108,178 | 7.4 |
| 62. Consumer goods not elsewhere specified, semi-durable | 235,577 | 229,852 | 2.5 |
| 63. Consumer goods not elsewhere specified, non-durable | 2,223,052 | 328,828 | 576.1 |
| 7. Goods not elsewhere specified | 98,427 | 105,358 | -6.6 |
| All groups | 24,854,827 | 21,465,102 | 15.8 |
| 2026 1-8 1,000 € | 2025 1-8 1,000 € | Change % |
|
|---|---|---|---|
| 1. Food and beverages | 1,239,369 | 1,232,263 | 0.6 |
| 11. Food and beverages, primary | 285,735 | 239,997 | 19.1 |
| 111. Food and beverages, primary, mainly for industry | 142,021 | 106,102 | 33.9 |
| 112. Food and beverages, primary, mainly for household consumption | 143,714 | 133,895 | 7.3 |
| 12. Food and beverages, processed | 953,634 | 992,267 | -3.9 |
| 121. Food and beverages, processed, mainly for industry | 68,151 | 100,324 | -32.1 |
| 122. Food and beverages, processed, mainly for household consumption | 885,482 | 891,943 | -0.7 |
| 2. Industrial supplies not elsewhere specified | 7,176,418 | 5,975,335 | 20.1 |
| 21. Industrial supplies not elsewhere specified, primary | 1,348,415 | 901,951 | 49.5 |
| 22. Industrial supplies not elsewhere specified, processed | 5,828,004 | 5,073,384 | 14.9 |
| 3. Fuels and lubricants | 1,134,120 | 1,128,027 | 0.5 |
| 31. Fuels and lubricants, primary | 613,707 | 619,098 | -0.9 |
| 32. Fuels and lubricants, processed | 520,414 | 508,930 | 2.3 |
| 321. Fuels and lubricants, motor spirit | 215 | 243 | -11.3 |
| 322. Fuels and lubricants, other | 520,198 | 508,687 | 2.3 |
| 4. Capital goods (except transport equipment), and parts and accessories thereof | 5,371,900 | 4,359,325 | 23.2 |
| 41. Capital goods (except transport equipment) | 3,480,424 | 2,736,920 | 27.2 |
| 42. Capital goods (except transport equipment), parts and accessories | 1,891,476 | 1,622,405 | 16.6 |
| 5. Transport equipment and parts and accessories thereof | 3,762,018 | 3,075,575 | 22.3 |
| 51. Passenger motor vehicles | 1,277,010 | 1,380,676 | -7.5 |
| 52. Transport equipment, other than passenger motor vehicles | 1,327,094 | 453,489 | 192.6 |
| 521. Transport equipment, other than passenger motor vehicles, industrial | 1,238,826 | 369,618 | 235.2 |
| 522. Transport equipment, other than passenger motor vehicles, non-industrial | 88,267 | 83,871 | 5.2 |
| 53. Transport equipment, parts and accessories | 1,157,914 | 1,241,410 | -6.7 |
| 6. Consumer goods not elsewhere specified | 1,884,631 | 1,684,264 | 11.9 |
| 61. Consumer goods not elsewhere specified, durable | 316,614 | 305,411 | 3.7 |
| 62. Consumer goods not elsewhere specified, semi-durable | 487,616 | 443,712 | 9.9 |
| 63. Consumer goods not elsewhere specified, non-durable | 1,080,401 | 935,141 | 15.5 |
| 7. Goods not elsewhere specified | 86,944 | 203,023 | -57.2 |
| All groups | 20,655,378 | 17,657,812 | 17.0 |
| Classification | Description | Year level | Quarter level | Month level | Year 2026 sofar |
|---|---|---|---|---|---|
| SITC | Standard International Trade Classification (classification system is maintained by the United Nations) | ███ | ███ | ███ | ███ |
| BEC | The standard of statistical classification of BEC (Broad Economic Categories) is upheld by the UN and it is based on SITC-nomenclature. | ███ | ███ | ███ | ███ |
| NACE | National industrial classification based on Statistical Classification of Economic Activities in the European Community Nomenclature générale des Activités économiques dans les Communautés européennes | ███ | ███ | ███ | ███ |
| CPA | CPA = Classification of Products by Activities | ███ | ███ | ███ | ███ |
| CN | The Combined Nomenclature is the common nomenclature of the European Community. | ███ | ███ | ███ | ███ |