
| Export of goods from Finland and import to Finland | BEC (Broad Economic Categories) |
*) The standard of statistical classification of BEC (Broad Economic Categories) is upheld by the UN and it is based on SITC-nomenclature.
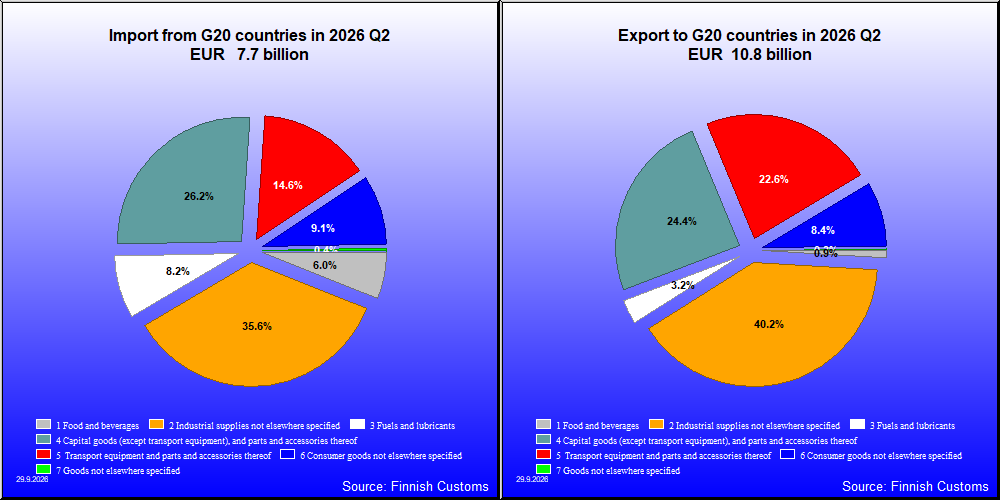
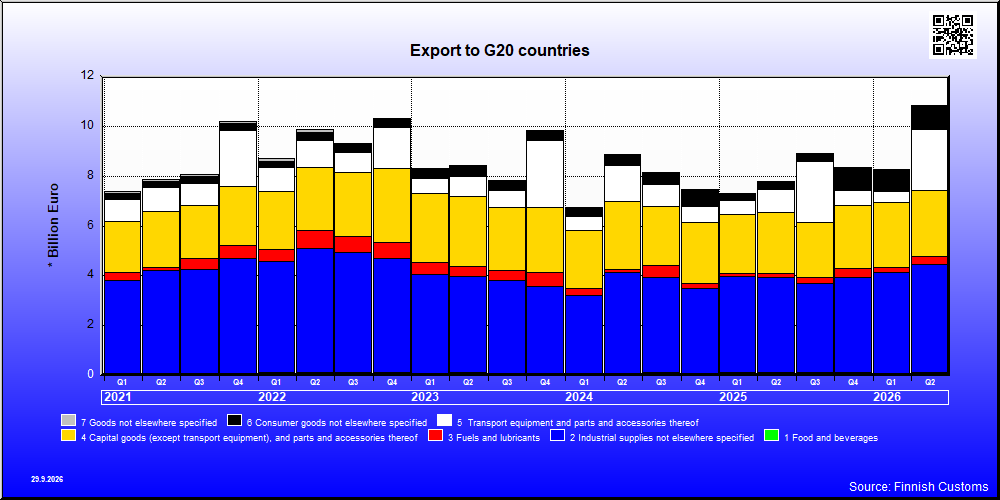
| Q2 / 2026 | Q2 / 2025 | Muutos edellisestä vastaavasta kaudesta % | ||
|---|---|---|---|---|
| 1,000 € | % | 1,000 € | ||
| 1. Food and beverages | 102,238 | 0.9 | 103,802 | -1.5 |
| 11. Food and beverages, primary | 27,569 | 0.3 | 14,042 | 96.3 |
| 111. Food and beverages, primary, mainly for industry | 1,209 | 0.0 | 1,394 | -13.3 |
| 112. Food and beverages, primary, mainly for household consumption | 26,360 | 0.2 | 12,647 | 108.4 |
| 12. Food and beverages, processed | 74,669 | 0.7 | 89,760 | -16.8 |
| 121. Food and beverages, processed, mainly for industry | 15,250 | 0.1 | 14,852 | 2.7 |
| 122. Food and beverages, processed, mainly for household consumption | 59,420 | 0.5 | 74,909 | -20.7 |
| 2. Industrial supplies not elsewhere specified | 4,352,430 | 40.2 | 3,825,171 | 13.8 |
| 21. Industrial supplies not elsewhere specified, primary | 409,971 | 3.8 | 312,169 | 31.3 |
| 22. Industrial supplies not elsewhere specified, processed | 3,942,459 | 36.4 | 3,513,002 | 12.2 |
| 3. Fuels and lubricants | 342,286 | 3.2 | 183,174 | 86.9 |
| 31. Fuels and lubricants, primary | 10,484 | 0.1 | 3,890 | 169.5 |
| 32. Fuels and lubricants, processed | 331,802 | 3.1 | 179,285 | 85.1 |
| 321. Fuels and lubricants, motor spirit | 289,441 | 2.7 | 144,466 | 100.4 |
| 322. Fuels and lubricants, other | 42,360 | 0.4 | 34,819 | 21.7 |
| 4. Capital goods (except transport equipment), and parts and accessories thereof | 2,641,113 | 24.4 | 2,424,457 | 8.9 |
| 41. Capital goods (except transport equipment) | 1,946,717 | 18.0 | 1,844,608 | 5.5 |
| 42. Capital goods (except transport equipment), parts and accessories | 694,396 | 6.4 | 579,850 | 19.8 |
| 5. Transport equipment and parts and accessories thereof | 2,446,245 | 22.6 | 918,166 | 166.4 |
| 51. Passenger motor vehicles | 2,604 | 0.0 | 162,869 | -98.4 |
| 52. Transport equipment, other than passenger motor vehicles | 2,107,866 | 19.5 | 459,811 | 358.4 |
| 521. Transport equipment, other than passenger motor vehicles, industrial | 2,055,672 | 19.0 | 393,844 | 422.0 |
| 522. Transport equipment, other than passenger motor vehicles, non-industrial | 52,194 | 0.5 | 66,085 | -21.0 |
| 53. Transport equipment, parts and accessories | 335,775 | 3.1 | 295,486 | 13.6 |
| 6. Consumer goods not elsewhere specified | 907,197 | 8.4 | 286,551 | 216.6 |
| 61. Consumer goods not elsewhere specified, durable | 47,190 | 0.4 | 47,968 | -1.6 |
| 62. Consumer goods not elsewhere specified, semi-durable | 90,665 | 0.8 | 82,731 | 9.6 |
| 63. Consumer goods not elsewhere specified, non-durable | 769,342 | 7.1 | 155,852 | 393.6 |
| 7. Goods not elsewhere specified | 33,982 | 0.3 | 34,166 | -0.5 |
| All groups | 10,825,491 | 100.0 | 7,775,487 | 39.2 |

| Q2 / 2026 | Q2 / 2025 | Muutos edellisestä vastaavasta kaudesta % | ||
|---|---|---|---|---|
| 1,000 € | % | 1,000 € | ||
| 1. Food and beverages | 459,761 | 6.0 | 469,828 | -2.1 |
| 11. Food and beverages, primary | 99,369 | 1.3 | 85,269 | 16.5 |
| 111. Food and beverages, primary, mainly for industry | 46,749 | 0.6 | 35,145 | 33.0 |
| 112. Food and beverages, primary, mainly for household consumption | 52,620 | 0.7 | 50,123 | 5.0 |
| 12. Food and beverages, processed | 360,392 | 4.7 | 384,559 | -6.3 |
| 121. Food and beverages, processed, mainly for industry | 25,859 | 0.3 | 43,898 | -41.1 |
| 122. Food and beverages, processed, mainly for household consumption | 334,533 | 4.3 | 340,662 | -1.8 |
| 2. Industrial supplies not elsewhere specified | 2,743,477 | 35.5 | 2,180,070 | 25.8 |
| 21. Industrial supplies not elsewhere specified, primary | 418,175 | 5.4 | 234,981 | 78.0 |
| 22. Industrial supplies not elsewhere specified, processed | 2,325,302 | 30.1 | 1,945,090 | 19.5 |
| 3. Fuels and lubricants | 632,299 | 8.2 | 441,453 | 43.2 |
| 31. Fuels and lubricants, primary | 366,383 | 4.7 | 215,808 | 69.8 |
| 32. Fuels and lubricants, processed | 265,916 | 3.4 | 225,645 | 17.8 |
| 321. Fuels and lubricants, motor spirit | 44 | 0.0 | 56 | -21.2 |
| 322. Fuels and lubricants, other | 265,872 | 3.4 | 225,589 | 17.9 |
| 4. Capital goods (except transport equipment), and parts and accessories thereof | 2,003,489 | 26.0 | 1,652,946 | 21.2 |
| 41. Capital goods (except transport equipment) | 1,270,877 | 16.5 | 1,036,445 | 22.6 |
| 42. Capital goods (except transport equipment), parts and accessories | 732,612 | 9.5 | 616,501 | 18.8 |
| 5. Transport equipment and parts and accessories thereof | 1,127,345 | 14.6 | 1,194,347 | -5.6 |
| 51. Passenger motor vehicles | 521,037 | 6.8 | 549,000 | -5.1 |
| 52. Transport equipment, other than passenger motor vehicles | 190,773 | 2.5 | 183,082 | 4.2 |
| 521. Transport equipment, other than passenger motor vehicles, industrial | 154,235 | 2.0 | 146,436 | 5.3 |
| 522. Transport equipment, other than passenger motor vehicles, non-industrial | 36,539 | 0.5 | 36,646 | -0.3 |
| 53. Transport equipment, parts and accessories | 415,535 | 5.4 | 462,265 | -10.1 |
| 6. Consumer goods not elsewhere specified | 703,701 | 9.1 | 632,568 | 11.2 |
| 61. Consumer goods not elsewhere specified, durable | 119,341 | 1.5 | 124,732 | -4.3 |
| 62. Consumer goods not elsewhere specified, semi-durable | 179,679 | 2.3 | 168,097 | 6.9 |
| 63. Consumer goods not elsewhere specified, non-durable | 404,681 | 5.2 | 339,740 | 19.1 |
| 7. Goods not elsewhere specified | 47,374 | 0.6 | 76,939 | -38.4 |
| All groups | 7,717,446 | 100.0 | 6,648,152 | 16.1 |
| Classification | Description | Year level | Quarter level | Month level | Year 2026 sofar |
|---|---|---|---|---|---|
| SITC | Standard International Trade Classification (classification system is maintained by the United Nations) | ███ | ███ | ███ | ███ |
| BEC | The standard of statistical classification of BEC (Broad Economic Categories) is upheld by the UN and it is based on SITC-nomenclature. | ███ | ███ | ███ | ███ |
| NACE | National industrial classification based on Statistical Classification of Economic Activities in the European Community Nomenclature générale des Activités économiques dans les Communautés européennes | ███ | ███ | ███ | ███ |
| CPA | CPA = Classification of Products by Activities | ███ | ███ | ███ | ███ |
| CN | The Combined Nomenclature is the common nomenclature of the European Community. | ███ | ███ | ███ | ███ |