
| Export of goods from Finland and import to Finland | BEC (Broad Economic Categories) |
*) The standard of statistical classification of BEC (Broad Economic Categories) is upheld by the UN and it is based on SITC-nomenclature.
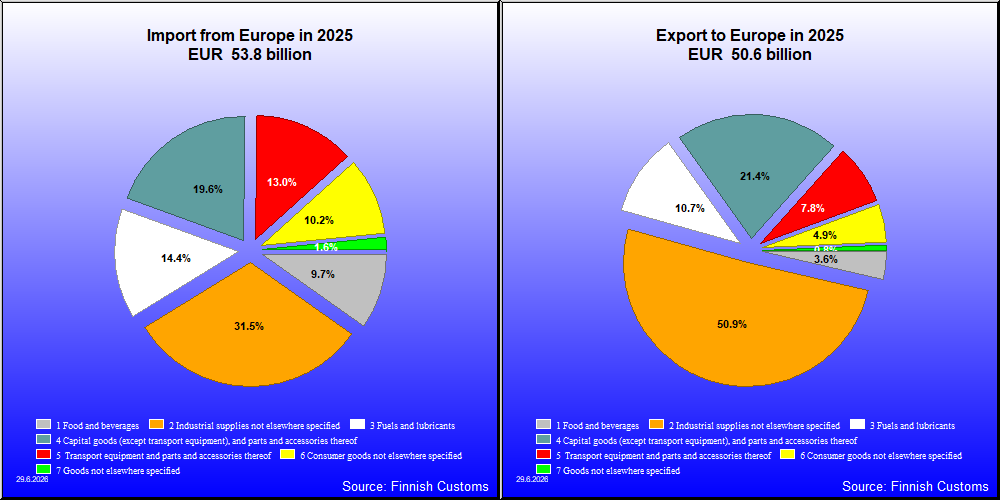

| 2021 | 2022 | 2023 | 2024 | 2025 | ||||||
|---|---|---|---|---|---|---|---|---|---|---|
| 1,000 € | % | 1,000 € | % | 1,000 € | % | 1,000 € | % | 1,000 € | % | |
| 1. Food and beverages | 1,226,789 | 2.5 | 1,543,356 | 2.7 | 1,586,639 | 3.1 | 1,673,353 | 3.4 | 1,802,364 | 3.6 |
| 11. Food and beverages, primary | 286,589 | 0.6 | 422,421 | 0.8 | 390,653 | 0.8 | 380,937 | 0.8 | 420,945 | 0.8 |
| 111. Food and beverages, primary, mainly for industry | 30,992 | 0.1 | 29,663 | 0.1 | 38,599 | 0.1 | 29,946 | 0.1 | 27,446 | 0.1 |
| 112. Food and beverages, primary, mainly for household consumption | 255,597 | 0.5 | 392,758 | 0.7 | 352,053 | 0.7 | 350,991 | 0.7 | 393,499 | 0.8 |
| 12. Food and beverages, processed | 940,200 | 1.9 | 1,120,935 | 2.0 | 1,195,987 | 2.4 | 1,292,415 | 2.6 | 1,381,420 | 2.7 |
| 121. Food and beverages, processed, mainly for industry | 141,892 | 0.3 | 169,320 | 0.3 | 164,090 | 0.3 | 172,514 | 0.4 | 202,662 | 0.4 |
| 122. Food and beverages, processed, mainly for household consumption | 798,308 | 1.6 | 951,615 | 1.7 | 1,031,897 | 2.0 | 1,119,903 | 2.3 | 1,178,757 | 2.3 |
| 2. Industrial supplies not elsewhere specified | 25,896,300 | 51.9 | 30,181,326 | 53.6 | 25,960,317 | 51.0 | 25,604,088 | 52.1 | 25,749,420 | 50.9 |
| 21. Industrial supplies not elsewhere specified, primary | 1,590,986 | 3.2 | 1,645,447 | 2.9 | 1,426,865 | 2.8 | 1,815,341 | 3.7 | 2,451,420 | 4.8 |
| 22. Industrial supplies not elsewhere specified, processed | 24,305,314 | 48.7 | 28,535,879 | 50.7 | 24,533,455 | 48.2 | 23,788,747 | 48.4 | 23,298,002 | 46.0 |
| 3. Fuels and lubricants | 3,827,372 | 7.7 | 6,127,944 | 10.9 | 5,349,342 | 10.5 | 4,017,587 | 8.2 | 5,392,766 | 10.7 |
| 31. Fuels and lubricants, primary | 32,608 | 0.1 | 119,418 | 0.2 | 259,489 | 0.5 | 292,313 | 0.6 | 197,848 | 0.4 |
| 32. Fuels and lubricants, processed | 3,794,764 | 7.6 | 6,008,526 | 10.7 | 5,089,883 | 10.0 | 3,725,274 | 7.6 | 5,194,918 | 10.3 |
| 321. Fuels and lubricants, motor spirit | 3,076,484 | 6.2 | 1,792,719 | 3.2 | 1,331,171 | 2.6 | 1,176,600 | 2.4 | 1,731,988 | 3.4 |
| 322. Fuels and lubricants, other | 718,280 | 1.4 | 4,215,807 | 7.5 | 3,758,712 | 7.4 | 2,574,311 | 5.2 | 3,462,930 | 6.8 |
| 4. Capital goods (except transport equipment), and parts and accessories thereof | 9,482,707 | 19.0 | 10,391,508 | 18.5 | 11,483,480 | 22.6 | 10,649,651 | 21.7 | 10,830,676 | 21.4 |
| 41. Capital goods (except transport equipment) | 6,635,911 | 13.3 | 7,598,905 | 13.5 | 8,458,948 | 16.6 | 7,645,448 | 15.6 | 7,706,353 | 15.2 |
| 42. Capital goods (except transport equipment), parts and accessories | 2,846,795 | 5.7 | 2,792,603 | 5.0 | 3,024,533 | 5.9 | 3,004,203 | 6.1 | 3,124,323 | 6.2 |
| 5. Transport equipment and parts and accessories thereof | 6,526,809 | 13.1 | 5,035,233 | 9.0 | 4,180,888 | 8.2 | 4,851,155 | 9.9 | 3,947,965 | 7.8 |
| 51. Passenger motor vehicles | 2,668,735 | 5.3 | 2,013,852 | 3.6 | 979,764 | 1.9 | 904,110 | 1.8 | 1,084,943 | 2.1 |
| 52. Transport equipment, other than passenger motor vehicles | 2,541,973 | 5.1 | 1,542,112 | 2.7 | 1,417,654 | 2.8 | 2,160,811 | 4.4 | 1,277,600 | 2.5 |
| 521. Transport equipment, other than passenger motor vehicles, industrial | 2,101,464 | 4.2 | 1,039,025 | 1.8 | 971,918 | 1.9 | 1,810,969 | 3.7 | 959,027 | 1.9 |
| 522. Transport equipment, other than passenger motor vehicles, non-industrial | 440,509 | 0.9 | 503,088 | 0.9 | 445,736 | 0.9 | 349,841 | 0.7 | 318,615 | 0.6 |
| 53. Transport equipment, parts and accessories | 1,316,101 | 2.6 | 1,479,305 | 2.6 | 1,783,471 | 3.5 | 1,786,290 | 3.6 | 1,585,449 | 3.1 |
| 6. Consumer goods not elsewhere specified | 1,639,086 | 3.3 | 1,959,492 | 3.5 | 2,103,539 | 4.1 | 2,135,626 | 4.3 | 2,500,925 | 4.9 |
| 61. Consumer goods not elsewhere specified, durable | 255,798 | 0.5 | 251,440 | 0.4 | 235,938 | 0.5 | 234,524 | 0.5 | 273,903 | 0.5 |
| 62. Consumer goods not elsewhere specified, semi-durable | 733,630 | 1.5 | 909,463 | 1.6 | 895,301 | 1.8 | 850,140 | 1.7 | 951,908 | 1.9 |
| 63. Consumer goods not elsewhere specified, non-durable | 649,658 | 1.3 | 798,589 | 1.4 | 972,300 | 1.9 | 1,050,962 | 2.1 | 1,275,114 | 2.5 |
| 7. Goods not elsewhere specified | 1,303,129 | 2.6 | 1,025,353 | 1.8 | 209,491 | 0.4 | 229,905 | 0.5 | 382,918 | 0.8 |
| All groups | 49,902,191 | 100.0 | 56,259,414 | 100.0 | 50,873,696 | 100.0 | 49,161,362 | 100.0 | 50,607,020 | 100.0 |

| 2021 | 2022 | 2023 | 2024 | 2025 | ||||||
|---|---|---|---|---|---|---|---|---|---|---|
| 1,000 € | % | 1,000 € | % | 1,000 € | % | 1,000 € | % | 1,000 € | % | |
| 1. Food and beverages | 3,741,334 | 6.7 | 4,515,282 | 6.6 | 4,789,947 | 8.5 | 4,978,835 | 9.1 | 5,222,670 | 9.7 |
| 11. Food and beverages, primary | 1,015,313 | 1.8 | 1,236,447 | 1.8 | 1,103,256 | 2.0 | 1,152,153 | 2.1 | 1,196,446 | 2.2 |
| 111. Food and beverages, primary, mainly for industry | 99,066 | 0.2 | 182,485 | 0.3 | 112,563 | 0.2 | 114,129 | 0.2 | 128,951 | 0.2 |
| 112. Food and beverages, primary, mainly for household consumption | 916,248 | 1.6 | 1,053,961 | 1.5 | 990,693 | 1.8 | 1,038,024 | 1.9 | 1,067,495 | 2.0 |
| 12. Food and beverages, processed | 2,726,021 | 4.8 | 3,278,835 | 4.8 | 3,686,693 | 6.6 | 3,826,685 | 7.0 | 4,026,224 | 7.5 |
| 121. Food and beverages, processed, mainly for industry | 157,414 | 0.3 | 213,745 | 0.3 | 236,067 | 0.4 | 310,139 | 0.6 | 356,667 | 0.7 |
| 122. Food and beverages, processed, mainly for household consumption | 2,568,607 | 4.6 | 3,065,090 | 4.5 | 3,450,626 | 6.1 | 3,516,547 | 6.5 | 3,669,558 | 6.8 |
| 2. Industrial supplies not elsewhere specified | 18,698,829 | 33.3 | 22,278,799 | 32.6 | 18,144,567 | 32.2 | 17,318,401 | 31.8 | 16,960,411 | 31.5 |
| 21. Industrial supplies not elsewhere specified, primary | 4,046,267 | 7.2 | 4,270,423 | 6.2 | 3,498,226 | 6.2 | 3,573,002 | 6.6 | 3,272,818 | 6.1 |
| 22. Industrial supplies not elsewhere specified, processed | 14,652,562 | 26.1 | 18,008,376 | 26.3 | 14,646,341 | 26.0 | 13,745,399 | 25.2 | 13,687,594 | 25.4 |
| 3. Fuels and lubricants | 9,088,230 | 16.2 | 15,502,260 | 22.7 | 8,913,184 | 15.8 | 8,306,720 | 15.3 | 7,735,247 | 14.4 |
| 31. Fuels and lubricants, primary | 4,656,400 | 8.3 | 8,126,313 | 11.9 | 5,398,391 | 9.6 | 4,581,720 | 8.4 | 4,558,170 | 8.5 |
| 32. Fuels and lubricants, processed | 4,431,830 | 7.9 | 7,380,865 | 10.8 | 3,518,904 | 6.3 | 3,725,000 | 6.8 | 3,177,078 | 5.9 |
| 321. Fuels and lubricants, motor spirit | 2,432,986 | 4.3 | 975,273 | 1.4 | 744,442 | 1.3 | 713,276 | 1.3 | 443,873 | 0.8 |
| 322. Fuels and lubricants, other | 1,998,844 | 3.6 | 6,405,591 | 9.4 | 2,774,462 | 4.9 | 3,077,742 | 5.7 | 2,733,205 | 5.1 |
| 4. Capital goods (except transport equipment), and parts and accessories thereof | 9,452,309 | 16.8 | 10,767,971 | 15.8 | 11,058,521 | 19.7 | 10,484,014 | 19.3 | 10,518,848 | 19.6 |
| 41. Capital goods (except transport equipment) | 5,503,303 | 9.8 | 6,111,427 | 8.9 | 6,388,789 | 11.4 | 6,271,788 | 11.5 | 6,266,333 | 11.6 |
| 42. Capital goods (except transport equipment), parts and accessories | 3,949,005 | 7.0 | 4,656,544 | 6.8 | 4,669,732 | 8.3 | 4,212,226 | 7.7 | 4,252,515 | 7.9 |
| 5. Transport equipment and parts and accessories thereof | 7,473,450 | 13.3 | 7,733,010 | 11.3 | 7,767,123 | 13.8 | 7,349,582 | 13.5 | 7,015,369 | 13.0 |
| 51. Passenger motor vehicles | 2,846,132 | 5.1 | 3,059,746 | 4.5 | 3,734,768 | 6.6 | 3,254,001 | 6.0 | 3,121,314 | 5.8 |
| 52. Transport equipment, other than passenger motor vehicles | 1,110,248 | 2.0 | 1,440,527 | 2.1 | 1,527,810 | 2.7 | 1,522,959 | 2.8 | 1,378,198 | 2.6 |
| 521. Transport equipment, other than passenger motor vehicles, industrial | 929,968 | 1.7 | 1,159,015 | 1.7 | 1,226,202 | 2.2 | 1,295,864 | 2.4 | 1,184,905 | 2.2 |
| 522. Transport equipment, other than passenger motor vehicles, non-industrial | 180,280 | 0.3 | 281,512 | 0.4 | 301,608 | 0.5 | 227,094 | 0.4 | 193,299 | 0.4 |
| 53. Transport equipment, parts and accessories | 3,517,070 | 6.3 | 3,232,737 | 4.7 | 2,504,545 | 4.5 | 2,572,623 | 4.7 | 2,515,857 | 4.7 |
| 6. Consumer goods not elsewhere specified | 4,525,551 | 8.0 | 5,110,949 | 7.5 | 5,365,691 | 9.5 | 5,258,804 | 9.7 | 5,469,402 | 10.2 |
| 61. Consumer goods not elsewhere specified, durable | 1,104,028 | 2.0 | 1,153,185 | 1.7 | 1,152,299 | 2.0 | 1,049,522 | 1.9 | 1,125,241 | 2.1 |
| 62. Consumer goods not elsewhere specified, semi-durable | 1,075,968 | 1.9 | 1,264,760 | 1.9 | 1,327,851 | 2.4 | 1,288,644 | 2.4 | 1,368,554 | 2.5 |
| 63. Consumer goods not elsewhere specified, non-durable | 2,345,554 | 4.2 | 2,693,003 | 3.9 | 2,885,541 | 5.1 | 2,920,638 | 5.4 | 2,975,608 | 5.5 |
| 7. Goods not elsewhere specified | 3,239,383 | 5.8 | 2,458,265 | 3.6 | 238,239 | 0.4 | 761,263 | 1.4 | 875,091 | 1.6 |
| All groups | 56,219,067 | 100.0 | 68,343,182 | 100.0 | 56,277,272 | 100.0 | 54,457,619 | 100.0 | 53,797,040 | 100.0 |
| Classification | Description | Year level | Quarter level | Month level | |
|---|---|---|---|---|---|
| SITC | Standard International Trade Classification (classification system is maintained by the United Nations) | ███ | ███ | ███ | |
| BEC | The standard of statistical classification of BEC (Broad Economic Categories) is upheld by the UN and it is based on SITC-nomenclature. | ███ | ███ | ███ | |
| NACE | National industrial classification based on Statistical Classification of Economic Activities in the European Community Nomenclature générale des Activités économiques dans les Communautés européennes | ███ | ███ | ███ | |
| CPA | CPA = Classification of Products by Activities | ███ | ███ | ███ | |
| CN | The Combined Nomenclature is the common nomenclature of the European Community. | ███ | ███ | ███ |