
| Export of goods from Finland and import to Finland | BEC (Broad Economic Categories) |
*) The standard of statistical classification of BEC (Broad Economic Categories) is upheld by the UN and it is based on SITC-nomenclature.
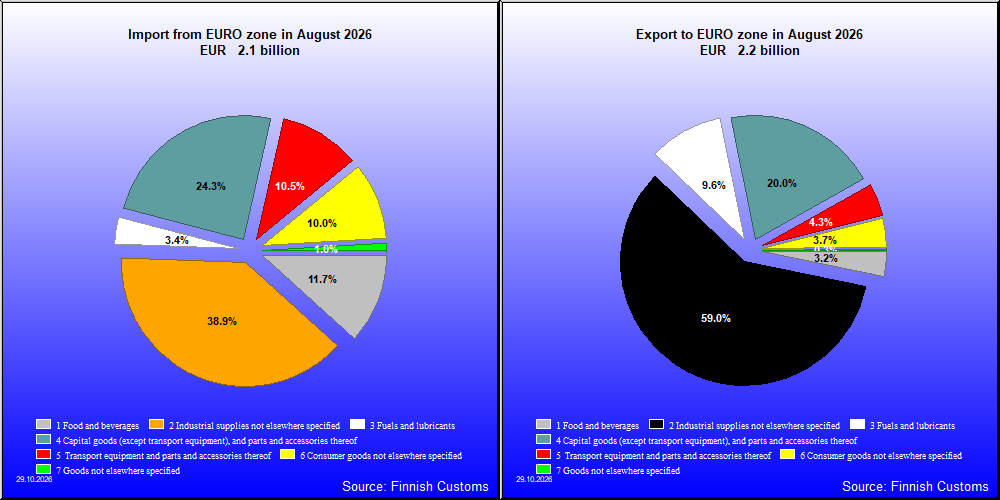

| 8 / 2026 | 8 / 2025 | Change from previous year's equal month % | ||
|---|---|---|---|---|
| 1,000 € | % | 1000 € | ||
| 1. Food and beverages | 67,972 | 3.2 | 66,069 | 2.9 |
| 11. Food and beverages, primary | 21,878 | 1.0 | 21,835 | 0.2 |
| 111. Food and beverages, primary, mainly for industry | 1,838 | 0.1 | 2,892 | -36.5 |
| 112. Food and beverages, primary, mainly for household consumption | 20,040 | 0.9 | 18,943 | 5.8 |
| 12. Food and beverages, processed | 46,094 | 2.1 | 44,234 | 4.2 |
| 121. Food and beverages, processed, mainly for industry | 7,711 | 0.4 | 6,136 | 25.7 |
| 122. Food and beverages, processed, mainly for household consumption | 38,384 | 1.8 | 38,098 | 0.8 |
| 2. Industrial supplies not elsewhere specified | 1,268,755 | 59.0 | 1,084,357 | 17.0 |
| 21. Industrial supplies not elsewhere specified, primary | 42,501 | 2.0 | 38,628 | 10.0 |
| 22. Industrial supplies not elsewhere specified, processed | 1,226,254 | 57.0 | 1,045,730 | 17.3 |
| 3. Fuels and lubricants | 207,024 | 9.6 | 162,608 | 27.3 |
| 31. Fuels and lubricants, primary | 21,078 | 1.0 | 2,470 | 753.3 |
| 32. Fuels and lubricants, processed | 185,946 | 8.6 | 160,138 | 16.1 |
| 321. Fuels and lubricants, motor spirit | 9,638 | 0.4 | 62,017 | -84.5 |
| 322. Fuels and lubricants, other | 176,308 | 8.2 | 98,121 | 79.7 |
| 4. Capital goods (except transport equipment), and parts and accessories thereof | 429,395 | 20.0 | 421,083 | 2.0 |
| 41. Capital goods (except transport equipment) | 291,880 | 13.6 | 288,232 | 1.3 |
| 42. Capital goods (except transport equipment), parts and accessories | 137,515 | 6.4 | 132,851 | 3.5 |
| 5. Transport equipment and parts and accessories thereof | 91,806 | 4.3 | 189,149 | -51.5 |
| 51. Passenger motor vehicles | 19,774 | 0.9 | 103,705 | -80.9 |
| 52. Transport equipment, other than passenger motor vehicles | 23,243 | 1.1 | 20,330 | 14.3 |
| 521. Transport equipment, other than passenger motor vehicles, industrial | 20,292 | 0.9 | 16,518 | 22.8 |
| 522. Transport equipment, other than passenger motor vehicles, non-industrial | 2,951 | 0.1 | 3,812 | -22.6 |
| 53. Transport equipment, parts and accessories | 48,789 | 2.3 | 65,114 | -25.1 |
| 6. Consumer goods not elsewhere specified | 79,260 | 3.7 | 73,442 | 7.9 |
| 61. Consumer goods not elsewhere specified, durable | 10,697 | 0.5 | 8,912 | 20.0 |
| 62. Consumer goods not elsewhere specified, semi-durable | 40,729 | 1.9 | 36,112 | 12.8 |
| 63. Consumer goods not elsewhere specified, non-durable | 27,834 | 1.3 | 28,418 | -2.1 |
| 7. Goods not elsewhere specified | 6,799 | 0.3 | 14,649 | -53.6 |
| All groups | 2,151,011 | 100.0 | 2,011,358 | 6.9 |

| 8 / 2026 | 8 / 2025 | Change from previous year's equal month % | ||
|---|---|---|---|---|
| 1,000 € | % | 1,000 € | ||
| 1. Food and beverages | 252,124 | 11.7 | 272,285 | -7.4 |
| 11. Food and beverages, primary | 57,368 | 2.7 | 62,039 | -7.5 |
| 111. Food and beverages, primary, mainly for industry | 20,562 | 1.0 | 20,452 | 0.5 |
| 112. Food and beverages, primary, mainly for household consumption | 36,805 | 1.7 | 41,587 | -11.5 |
| 12. Food and beverages, processed | 194,756 | 9.1 | 210,247 | -7.4 |
| 121. Food and beverages, processed, mainly for industry | 16,751 | 0.8 | 19,832 | -15.5 |
| 122. Food and beverages, processed, mainly for household consumption | 178,005 | 8.3 | 190,415 | -6.5 |
| 2. Industrial supplies not elsewhere specified | 836,232 | 38.9 | 800,165 | 4.5 |
| 21. Industrial supplies not elsewhere specified, primary | 170,086 | 7.9 | 158,407 | 7.4 |
| 22. Industrial supplies not elsewhere specified, processed | 666,146 | 31.0 | 641,758 | 3.8 |
| 3. Fuels and lubricants | 73,598 | 3.4 | 94,646 | -22.2 |
| 31. Fuels and lubricants, primary | 26,763 | 1.2 | 27,353 | -2.2 |
| 32. Fuels and lubricants, processed | 46,835 | 2.2 | 67,293 | -30.4 |
| 321. Fuels and lubricants, motor spirit | 183 | 0.0 | 100 | 83.5 |
| 322. Fuels and lubricants, other | 46,652 | 2.2 | 67,193 | -30.6 |
| 4. Capital goods (except transport equipment), and parts and accessories thereof | 523,090 | 24.3 | 483,515 | 8.2 |
| 41. Capital goods (except transport equipment) | 295,981 | 13.8 | 277,811 | 6.5 |
| 42. Capital goods (except transport equipment), parts and accessories | 227,110 | 10.6 | 205,704 | 10.4 |
| 5. Transport equipment and parts and accessories thereof | 226,404 | 10.5 | 311,314 | -27.3 |
| 51. Passenger motor vehicles | 98,448 | 4.6 | 107,797 | -8.7 |
| 52. Transport equipment, other than passenger motor vehicles | 42,661 | 2.0 | 60,160 | -29.1 |
| 521. Transport equipment, other than passenger motor vehicles, industrial | 37,963 | 1.8 | 54,051 | -29.8 |
| 522. Transport equipment, other than passenger motor vehicles, non-industrial | 4,699 | 0.2 | 6,109 | -23.1 |
| 53. Transport equipment, parts and accessories | 85,295 | 4.0 | 143,358 | -40.5 |
| 6. Consumer goods not elsewhere specified | 215,414 | 10.0 | 234,793 | -8.3 |
| 61. Consumer goods not elsewhere specified, durable | 36,078 | 1.7 | 39,045 | -7.6 |
| 62. Consumer goods not elsewhere specified, semi-durable | 50,491 | 2.3 | 58,510 | -13.7 |
| 63. Consumer goods not elsewhere specified, non-durable | 128,845 | 6.0 | 137,238 | -6.1 |
| 7. Goods not elsewhere specified | 22,245 | 1.0 | 38,405 | -42.1 |
| All groups | 2,149,107 | 100.0 | 2,235,123 | -3.8 |
| Classification | Description | Year level | Quarter level | Month level | Year 2026 sofar |
|---|---|---|---|---|---|
| SITC | Standard International Trade Classification (classification system is maintained by the United Nations) | ███ | ███ | ███ | ███ |
| BEC | The standard of statistical classification of BEC (Broad Economic Categories) is upheld by the UN and it is based on SITC-nomenclature. | ███ | ███ | ███ | ███ |
| NACE | National industrial classification based on Statistical Classification of Economic Activities in the European Community Nomenclature générale des Activités économiques dans les Communautés européennes | ███ | ███ | ███ | ███ |
| CPA | CPA = Classification of Products by Activities | ███ | ███ | ███ | ███ |
| CN | The Combined Nomenclature is the common nomenclature of the European Community. | ███ | ███ | ███ | ███ |