
| Export of goods from Finland and import to Finland | BEC (Broad Economic Categories) |
*) The standard of statistical classification of BEC (Broad Economic Categories) is upheld by the UN and it is based on SITC-nomenclature.
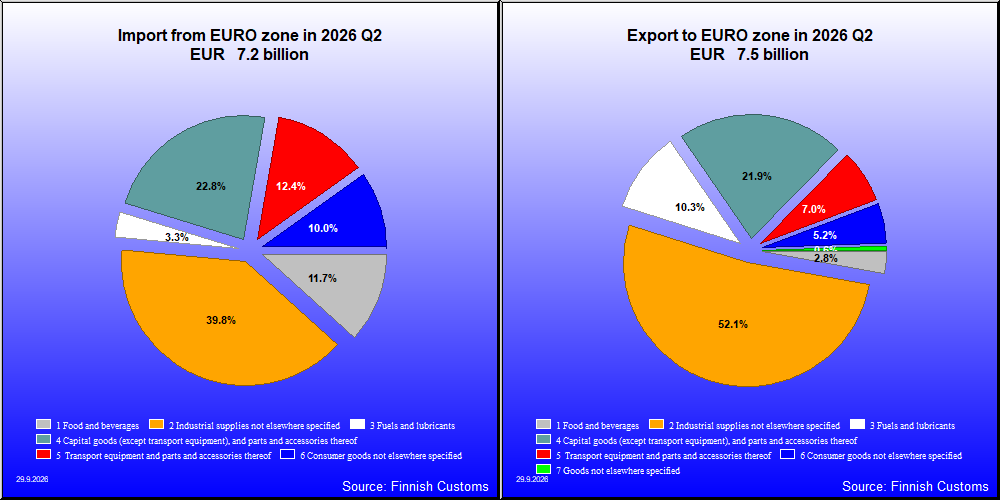
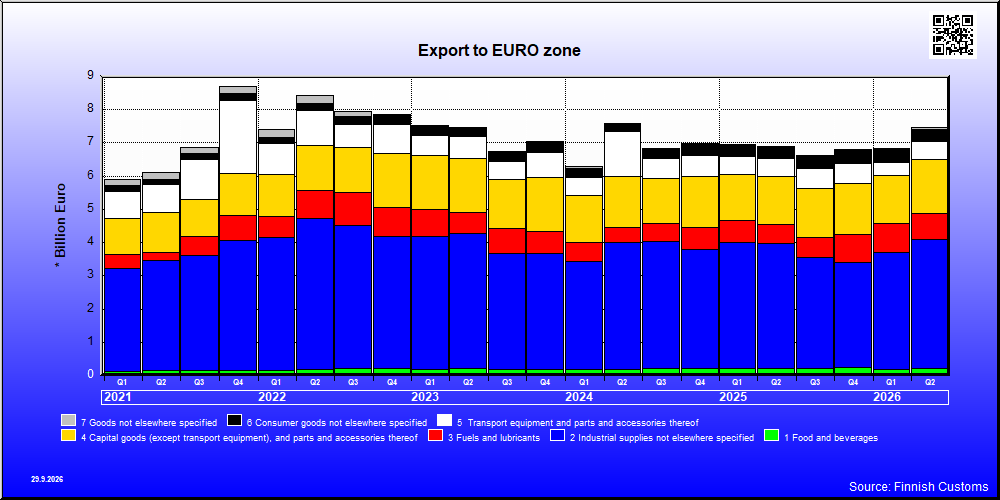
| Q2 / 2026 | Q2 / 2025 | Muutos edellisestä vastaavasta kaudesta % | ||
|---|---|---|---|---|
| 1,000 € | % | 1,000 € | ||
| 1. Food and beverages | 211,722 | 2.9 | 203,405 | 4.1 |
| 11. Food and beverages, primary | 63,597 | 0.9 | 43,130 | 47.5 |
| 111. Food and beverages, primary, mainly for industry | 10,298 | 0.1 | 6,157 | 67.2 |
| 112. Food and beverages, primary, mainly for household consumption | 53,305 | 0.7 | 36,972 | 44.2 |
| 12. Food and beverages, processed | 148,125 | 2.0 | 160,276 | -7.6 |
| 121. Food and beverages, processed, mainly for industry | 25,088 | 0.3 | 23,097 | 8.6 |
| 122. Food and beverages, processed, mainly for household consumption | 123,036 | 1.7 | 137,178 | -10.3 |
| 2. Industrial supplies not elsewhere specified | 3,759,442 | 51.4 | 3,758,039 | 0.0 |
| 21. Industrial supplies not elsewhere specified, primary | 184,323 | 2.5 | 169,033 | 9.0 |
| 22. Industrial supplies not elsewhere specified, processed | 3,575,119 | 48.8 | 3,589,006 | -0.4 |
| 3. Fuels and lubricants | 772,024 | 10.5 | 585,255 | 31.9 |
| 31. Fuels and lubricants, primary | 100,082 | 1.4 | 49,377 | 102.7 |
| 32. Fuels and lubricants, processed | 671,942 | 9.2 | 535,878 | 25.4 |
| 321. Fuels and lubricants, motor spirit | 196,107 | 2.7 | 211,531 | -7.3 |
| 322. Fuels and lubricants, other | 475,836 | 6.5 | 324,347 | 46.7 |
| 4. Capital goods (except transport equipment), and parts and accessories thereof | 1,628,742 | 22.3 | 1,455,717 | 11.9 |
| 41. Capital goods (except transport equipment) | 1,154,135 | 15.8 | 1,039,103 | 11.1 |
| 42. Capital goods (except transport equipment), parts and accessories | 474,606 | 6.5 | 416,613 | 13.9 |
| 5. Transport equipment and parts and accessories thereof | 517,559 | 7.1 | 524,267 | -1.3 |
| 51. Passenger motor vehicles | 76,552 | 1.0 | 217,081 | -64.7 |
| 52. Transport equipment, other than passenger motor vehicles | 153,689 | 2.1 | 95,811 | 60.4 |
| 521. Transport equipment, other than passenger motor vehicles, industrial | 97,388 | 1.3 | 68,659 | 41.8 |
| 522. Transport equipment, other than passenger motor vehicles, non-industrial | 56,301 | 0.8 | 27,152 | 107.4 |
| 53. Transport equipment, parts and accessories | 287,318 | 3.9 | 211,375 | 35.9 |
| 6. Consumer goods not elsewhere specified | 383,997 | 5.2 | 346,637 | 10.8 |
| 61. Consumer goods not elsewhere specified, durable | 37,343 | 0.5 | 38,346 | -2.6 |
| 62. Consumer goods not elsewhere specified, semi-durable | 101,044 | 1.4 | 104,277 | -3.1 |
| 63. Consumer goods not elsewhere specified, non-durable | 245,609 | 3.4 | 204,014 | 20.4 |
| 7. Goods not elsewhere specified | 46,508 | 0.6 | 31,460 | 47.8 |
| All groups | 7,319,992 | 100.0 | 6,904,780 | 6.0 |

| Q2 / 2026 | Q2 / 2025 | Muutos edellisestä vastaavasta kaudesta % | ||
|---|---|---|---|---|
| 1,000 € | % | 1,000 € | ||
| 1. Food and beverages | 831,408 | 11.6 | 846,130 | -1.7 |
| 11. Food and beverages, primary | 216,446 | 3.0 | 184,319 | 17.4 |
| 111. Food and beverages, primary, mainly for industry | 36,106 | 0.5 | 13,775 | 162.1 |
| 112. Food and beverages, primary, mainly for household consumption | 180,351 | 2.5 | 170,544 | 5.8 |
| 12. Food and beverages, processed | 614,962 | 8.6 | 661,811 | -7.1 |
| 121. Food and beverages, processed, mainly for industry | 47,964 | 0.7 | 80,925 | -40.7 |
| 122. Food and beverages, processed, mainly for household consumption | 566,998 | 7.9 | 580,885 | -2.4 |
| 2. Industrial supplies not elsewhere specified | 2,839,871 | 39.6 | 2,506,899 | 13.3 |
| 21. Industrial supplies not elsewhere specified, primary | 501,164 | 7.0 | 493,411 | 1.6 |
| 22. Industrial supplies not elsewhere specified, processed | 2,338,708 | 32.6 | 2,013,489 | 16.2 |
| 3. Fuels and lubricants | 238,713 | 3.3 | 150,943 | 58.1 |
| 31. Fuels and lubricants, primary | 59,781 | 0.8 | 31,246 | 91.3 |
| 32. Fuels and lubricants, processed | 178,932 | 2.5 | 119,697 | 49.5 |
| 321. Fuels and lubricants, motor spirit | 387 | 0.0 | 50 | 674.5 |
| 322. Fuels and lubricants, other | 178,545 | 2.5 | 119,647 | 49.2 |
| 4. Capital goods (except transport equipment), and parts and accessories thereof | 1,614,202 | 22.5 | 1,543,726 | 4.6 |
| 41. Capital goods (except transport equipment) | 920,524 | 12.8 | 877,078 | 5.0 |
| 42. Capital goods (except transport equipment), parts and accessories | 693,678 | 9.7 | 666,648 | 4.1 |
| 5. Transport equipment and parts and accessories thereof | 895,406 | 12.5 | 1,069,811 | -16.3 |
| 51. Passenger motor vehicles | 418,441 | 5.8 | 469,174 | -10.8 |
| 52. Transport equipment, other than passenger motor vehicles | 177,893 | 2.5 | 184,956 | -3.8 |
| 521. Transport equipment, other than passenger motor vehicles, industrial | 149,792 | 2.1 | 152,444 | -1.7 |
| 522. Transport equipment, other than passenger motor vehicles, non-industrial | 28,101 | 0.4 | 32,512 | -13.6 |
| 53. Transport equipment, parts and accessories | 299,072 | 4.2 | 415,681 | -28.1 |
| 6. Consumer goods not elsewhere specified | 724,807 | 10.1 | 737,516 | -1.7 |
| 61. Consumer goods not elsewhere specified, durable | 117,795 | 1.6 | 131,422 | -10.4 |
| 62. Consumer goods not elsewhere specified, semi-durable | 149,937 | 2.1 | 175,247 | -14.4 |
| 63. Consumer goods not elsewhere specified, non-durable | 457,074 | 6.4 | 430,848 | 6.1 |
| 7. Goods not elsewhere specified | 26,772 | 0.4 | 111,673 | -76.0 |
| All groups | 7,171,179 | 100.0 | 6,966,697 | 2.9 |
| Classification | Description | Year level | Quarter level | Month level | Year 2026 sofar |
|---|---|---|---|---|---|
| SITC | Standard International Trade Classification (classification system is maintained by the United Nations) | ███ | ███ | ███ | ███ |
| BEC | The standard of statistical classification of BEC (Broad Economic Categories) is upheld by the UN and it is based on SITC-nomenclature. | ███ | ███ | ███ | ███ |
| NACE | National industrial classification based on Statistical Classification of Economic Activities in the European Community Nomenclature générale des Activités économiques dans les Communautés européennes | ███ | ███ | ███ | ███ |
| CPA | CPA = Classification of Products by Activities | ███ | ███ | ███ | ███ |
| CN | The Combined Nomenclature is the common nomenclature of the European Community. | ███ | ███ | ███ | ███ |