
| Export of goods from Finland and import to Finland | Trade Balance |

| Import 1,000 € | Export 1,000 € | Trade 1,000 € | Trade Balance 1,000 € | |
|---|---|---|---|---|
| 2019 Q1 | 3,592,223 | 1,792,471 | 5,384,694 | -1,799,752 |
| 2019 Q2 | 3,624,909 | 2,165,148 | 5,790,058 | -1,459,761 |
| 2019 Q3 | 3,831,758 | 2,093,100 | 5,924,858 | -1,738,657 |
| 2019 Q4 | 3,674,986 | 1,967,316 | 5,642,302 | -1,707,670 |
| 2020 Q1 | 3,216,064 | 1,670,583 | 4,886,647 | -1,545,482 |
| 2020 Q2 | 2,624,609 | 1,681,080 | 4,305,689 | -943,529 |
| 2020 Q3 | 3,154,761 | 1,796,887 | 4,951,648 | -1,357,874 |
| 2020 Q4 | 3,040,961 | 1,975,136 | 5,016,098 | -1,065,825 |
| 2021 Q1 | 3,510,002 | 1,890,936 | 5,400,938 | -1,619,066 |
| 2021 Q2 | 3,160,202 | 2,224,744 | 5,384,946 | -935,458 |
| 2021 Q3 | 3,985,224 | 2,047,443 | 6,032,667 | -1,937,780 |
| 2021 Q4 | 5,430,944 | 2,252,909 | 7,683,853 | -3,178,034 |
| 2022 Q1 | 5,342,329 | 2,054,875 | 7,397,204 | -3,287,455 |
| 2022 Q2 | 3,862,823 | 1,861,566 | 5,724,388 | -2,001,257 |
| 2022 Q3 | 3,688,807 | 1,716,986 | 5,405,793 | -1,971,821 |
| 2022 Q4 | 3,219,912 | 2,097,214 | 5,317,126 | -1,122,698 |
| 2023 Q1 | 2,507,522 | 1,625,403 | 4,132,925 | -882,119 |
| 2023 Q2 | 2,185,421 | 1,512,872 | 3,698,293 | -672,550 |
| 2023 Q3 | 2,452,686 | 1,282,364 | 3,735,050 | -1,170,322 |
| 2023 Q4 | 2,620,009 | 1,314,100 | 3,934,109 | -1,305,909 |
| 2024 Q1 | 2,101,367 | 1,030,419 | 3,131,785 | -1,070,948 |
| 2024 Q2 | 2,598,649 | 1,436,505 | 4,035,154 | -1,162,144 |
| 2024 Q3 | 2,595,168 | 1,265,914 | 3,861,082 | -1,329,254 |
| 2024 Q4 | 2,392,953 | 1,343,080 | 3,736,033 | -1,049,873 |
| 2025 Q1 | 2,302,595 | 1,300,426 | 3,603,021 | -1,002,170 |
| 2025 Q2 | 2,191,105 | 1,086,427 | 3,277,531 | -1,104,678 |
| 2025 Q3 | 2,367,643 | 1,139,335 | 3,506,978 | -1,228,308 |
| 2025 Q4 | 2,597,509 | 1,366,713 | 3,964,222 | -1,230,796 |
| 2026 Q1 | 2,815,464 | 1,373,430 | 4,188,893 | -1,442,034 |
| 2026 Q2 | 2,791,770 | 1,357,351 | 4,149,121 | -1,434,419 |
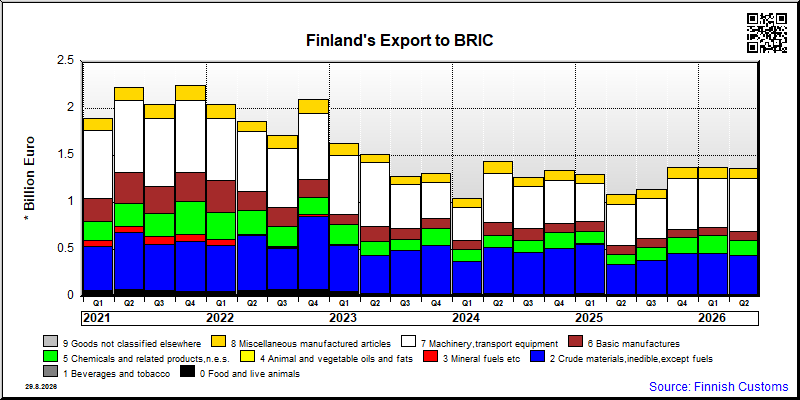
| Q2 / 2026 | Q2 / 2025 | Muutos edellisestä vastaavasta kaudesta % | ||
|---|---|---|---|---|
| 1,000 € | % | 1,000 € | ||
| 0. Food and live animals | 20,775 | 1.5 | 21,576 | -3.7 |
| 1. Beverages and tobacco | 184 | 0.0 | 341 | -45.9 |
| 2. Crude materials,inedible,except fuels | 413,181 | 30.4 | 321,369 | 28.6 |
| 3. Mineral fuels etc | 805 | 0.1 | 195 | 313.1 |
| 4. Animal and vegetable oils and fats | 33 | 0.0 | 28 | 20.1 |
| 5. Chemicals and related products,n.e.s. | 158,449 | 11.7 | 106,541 | 48.7 |
| 6. Basic manufactures | 96,423 | 7.1 | 93,931 | 2.7 |
| 7. Machinery,transport equipment | 563,592 | 41.5 | 429,570 | 31.2 |
| 8. Miscellaneous manufactured articles | 103,908 | 7.7 | 112,928 | -8.0 |
| 9. Goods not classified elsewhere | 0 | 0 | 0 | .. |
| All groups combined | 1,357,351 | 100.0 | 1,086,479 | 24.9 |

| Q2 / 2026 | Q2 / 2025 | Muutos edellisestä vastaavasta kaudesta % | ||
|---|---|---|---|---|
| 1,000 € | % | 1,000 € | ||
| 0. Food and live animals | 67,435 | 2.4 | 52,666 | 28.0 |
| 1. Beverages and tobacco | 752 | 0.0 | 218 | 245.0 |
| 2. Crude materials,inedible,except fuels | 232,211 | 8.3 | 210,702 | 10.2 |
| 3. Mineral fuels etc | 245 | 0.0 | 331 | -26.0 |
| 4. Animal and vegetable oils and fats | 5,185 | 0.2 | 581 | 793.2 |
| 5. Chemicals and related products,n.e.s. | 140,424 | 5.0 | 110,257 | 27.4 |
| 6. Basic manufactures | 342,256 | 12.3 | 234,274 | 46.1 |
| 7. Machinery,transport equipment | 1,524,509 | 54.6 | 1,133,856 | 34.5 |
| 8. Miscellaneous manufactured articles | 431,826 | 15.5 | 329,966 | 30.9 |
| 9. Goods not classified elsewhere | 46,926 | 1.7 | 58,665 | -20.0 |
| All groups combined | 2,791,770 | 100.0 | 2,131,516 | 31.0 |
| Classification | Description | Year level | Quarter level | Month level | Year 2026 sofar |
|---|---|---|---|---|---|
| SITC | Standard International Trade Classification (classification system is maintained by the United Nations) | ███ | ███ | ███ | ███ |
| BEC | The standard of statistical classification of BEC (Broad Economic Categories) is upheld by the UN and it is based on SITC-nomenclature. | ███ | ███ | ███ | ███ |
| NACE | National industrial classification based on Statistical Classification of Economic Activities in the European Community Nomenclature générale des Activités économiques dans les Communautés européennes | ███ | ███ | ███ | ███ |
| CPA | CPA = Classification of Products by Activities | ███ | ███ | ███ | ███ |
| CN | The Combined Nomenclature is the common nomenclature of the European Community. | ███ | ███ | ███ | ███ |