
| Export of goods from Finland and import to Finland | BEC (Broad Economic Categories) |
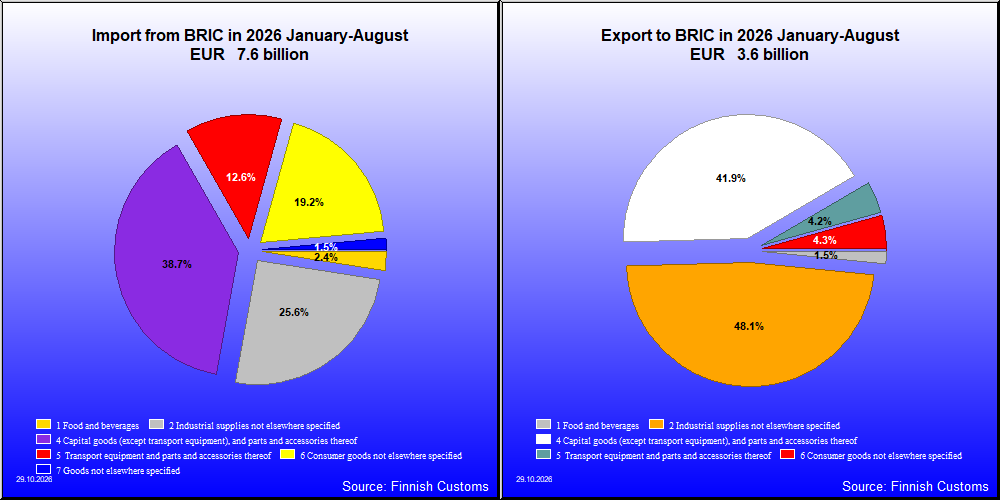
| 2026 1-8 1,000 € | 2025 1-8 1,000 € | Change % |
|
|---|---|---|---|
| 1. Food and beverages | 52,761 | 63,217 | -16.5 |
| 11. Food and beverages, primary | 1,466 | 1,860 | -21.2 |
| 111. Food and beverages, primary, mainly for industry | 38 | 0 | .. |
| 112. Food and beverages, primary, mainly for household consumption | 1,428 | 1,860 | -23.2 |
| 12. Food and beverages, processed | 51,295 | 61,357 | -16.4 |
| 121. Food and beverages, processed, mainly for industry | 29,362 | 34,481 | -14.8 |
| 122. Food and beverages, processed, mainly for household consumption | 21,933 | 26,876 | -18.4 |
| 2. Industrial supplies not elsewhere specified | 1,720,821 | 1,601,289 | 7.5 |
| 21. Industrial supplies not elsewhere specified, primary | 223,055 | 122,997 | 81.3 |
| 22. Industrial supplies not elsewhere specified, processed | 1,497,766 | 1,478,293 | 1.3 |
| 3. Fuels and lubricants | 2,220 | 1,516 | 46.5 |
| 31. Fuels and lubricants, primary | 2,061 | 1,389 | 48.4 |
| 32. Fuels and lubricants, processed | 159 | 127 | 25.7 |
| 322. Fuels and lubricants, other | 159 | 127 | 25.7 |
| 4. Capital goods (except transport equipment), and parts and accessories thereof | 1,499,285 | 1,219,923 | 22.9 |
| 41. Capital goods (except transport equipment) | 881,457 | 768,342 | 14.7 |
| 42. Capital goods (except transport equipment), parts and accessories | 617,828 | 451,581 | 36.8 |
| 5. Transport equipment and parts and accessories thereof | 149,800 | 120,025 | 24.8 |
| 51. Passenger motor vehicles | 385 | 13 | .. |
| 52. Transport equipment, other than passenger motor vehicles | 20,614 | 18,776 | 9.8 |
| 521. Transport equipment, other than passenger motor vehicles, industrial | 19,843 | 16,405 | 21.0 |
| 522. Transport equipment, other than passenger motor vehicles, non-industrial | 771 | 2,370 | -67.5 |
| 53. Transport equipment, parts and accessories | 128,801 | 101,236 | 27.2 |
| 6. Consumer goods not elsewhere specified | 154,566 | 72,790 | 112.3 |
| 61. Consumer goods not elsewhere specified, durable | 6,337 | 12,424 | -49.0 |
| 62. Consumer goods not elsewhere specified, semi-durable | 28,027 | 27,067 | 3.5 |
| 63. Consumer goods not elsewhere specified, non-durable | 120,202 | 33,300 | 261.0 |
| 7. Goods not elsewhere specified | 3,925 | 2,235 | 75.6 |
| All groups | 3,583,379 | 3,080,995 | 16.3 |
| 2026 1-8 1,000 € | 2025 1-8 1,000 € | Change % |
|
|---|---|---|---|
| 1. Food and beverages | 183,366 | 144,804 | 26.6 |
| 11. Food and beverages, primary | 134,233 | 101,335 | 32.5 |
| 111. Food and beverages, primary, mainly for industry | 110,973 | 84,562 | 31.2 |
| 112. Food and beverages, primary, mainly for household consumption | 23,260 | 16,774 | 38.7 |
| 12. Food and beverages, processed | 49,133 | 43,469 | 13.0 |
| 121. Food and beverages, processed, mainly for industry | 2,089 | 1,162 | 79.8 |
| 122. Food and beverages, processed, mainly for household consumption | 47,044 | 42,307 | 11.2 |
| 2. Industrial supplies not elsewhere specified | 1,953,354 | 1,542,609 | 26.6 |
| 21. Industrial supplies not elsewhere specified, primary | 244,489 | 206,398 | 18.5 |
| 22. Industrial supplies not elsewhere specified, processed | 1,708,865 | 1,336,211 | 27.9 |
| 3. Fuels and lubricants | 1,320 | 1,213 | 8.8 |
| 31. Fuels and lubricants, primary | 140 | 0 | .. |
| 32. Fuels and lubricants, processed | 1,180 | 1,213 | -2.7 |
| 321. Fuels and lubricants, motor spirit | 0 | 0 | .. |
| 322. Fuels and lubricants, other | 1,180 | 1,213 | -2.7 |
| 4. Capital goods (except transport equipment), and parts and accessories thereof | 2,958,001 | 2,137,266 | 38.4 |
| 41. Capital goods (except transport equipment) | 2,110,605 | 1,588,218 | 32.9 |
| 42. Capital goods (except transport equipment), parts and accessories | 847,396 | 549,048 | 54.3 |
| 5. Transport equipment and parts and accessories thereof | 961,196 | 787,580 | 22.0 |
| 51. Passenger motor vehicles | 159,875 | 115,972 | 37.9 |
| 52. Transport equipment, other than passenger motor vehicles | 119,416 | 90,508 | 31.9 |
| 521. Transport equipment, other than passenger motor vehicles, industrial | 90,651 | 56,811 | 59.6 |
| 522. Transport equipment, other than passenger motor vehicles, non-industrial | 28,766 | 33,697 | -14.6 |
| 53. Transport equipment, parts and accessories | 681,904 | 581,100 | 17.3 |
| 6. Consumer goods not elsewhere specified | 1,469,035 | 1,137,846 | 29.1 |
| 61. Consumer goods not elsewhere specified, durable | 369,675 | 281,032 | 31.5 |
| 62. Consumer goods not elsewhere specified, semi-durable | 852,699 | 652,082 | 30.8 |
| 63. Consumer goods not elsewhere specified, non-durable | 246,661 | 204,732 | 20.5 |
| 7. Goods not elsewhere specified | 116,468 | 148,504 | -21.6 |
| All groups | 7,642,740 | 5,899,823 | 29.5 |
| Classification | Description | Year level | Quarter level | Month level | Year 2026 sofar |
|---|---|---|---|---|---|
| SITC | Standard International Trade Classification (classification system is maintained by the United Nations) | ███ | ███ | ███ | ███ |
| BEC | The standard of statistical classification of BEC (Broad Economic Categories) is upheld by the UN and it is based on SITC-nomenclature. | ███ | ███ | ███ | ███ |
| NACE | National industrial classification based on Statistical Classification of Economic Activities in the European Community Nomenclature générale des Activités économiques dans les Communautés européennes | ███ | ███ | ███ | ███ |
| CPA | CPA = Classification of Products by Activities | ███ | ███ | ███ | ███ |
| CN | The Combined Nomenclature is the common nomenclature of the European Community. | ███ | ███ | ███ | ███ |