
| Export of goods from Finland and import to Finland | BEC (Broad Economic Categories) |
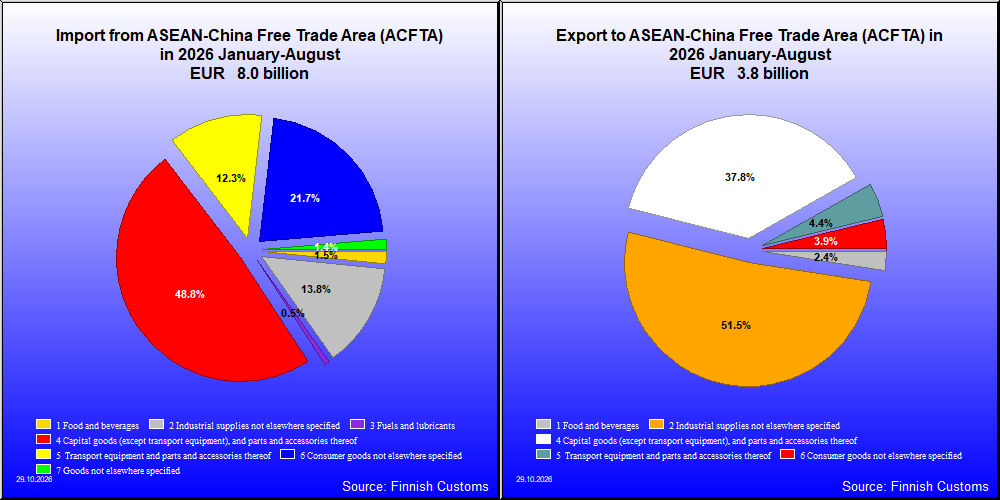
| 2026 1-8 1,000 € | 2025 1-8 1,000 € | Change % |
|
|---|---|---|---|
| 1. Food and beverages | 121,829 | 104,813 | 16.2 |
| 11. Food and beverages, primary | 23,657 | 18,787 | 25.9 |
| 111. Food and beverages, primary, mainly for industry | 3,096 | 1,754 | 76.6 |
| 112. Food and beverages, primary, mainly for household consumption | 20,560 | 17,033 | 20.7 |
| 12. Food and beverages, processed | 98,172 | 86,026 | 14.1 |
| 121. Food and beverages, processed, mainly for industry | 1,431 | 542 | 164.2 |
| 122. Food and beverages, processed, mainly for household consumption | 96,741 | 85,485 | 13.2 |
| 2. Industrial supplies not elsewhere specified | 1,100,264 | 779,334 | 41.2 |
| 21. Industrial supplies not elsewhere specified, primary | 45,176 | 42,119 | 7.3 |
| 22. Industrial supplies not elsewhere specified, processed | 1,055,088 | 737,215 | 43.1 |
| 3. Fuels and lubricants | 41,741 | 74,389 | -43.9 |
| 31. Fuels and lubricants, primary | 0 | 0 | -59.0 |
| 32. Fuels and lubricants, processed | 41,741 | 74,389 | -43.9 |
| 321. Fuels and lubricants, motor spirit | 0 | 0 | .. |
| 322. Fuels and lubricants, other | 41,741 | 74,389 | -43.9 |
| 4. Capital goods (except transport equipment), and parts and accessories thereof | 3,900,998 | 2,587,774 | 50.7 |
| 41. Capital goods (except transport equipment) | 2,860,281 | 1,960,201 | 45.9 |
| 42. Capital goods (except transport equipment), parts and accessories | 1,040,717 | 627,573 | 65.8 |
| 5. Transport equipment and parts and accessories thereof | 982,292 | 819,568 | 19.9 |
| 51. Passenger motor vehicles | 152,636 | 115,659 | 32.0 |
| 52. Transport equipment, other than passenger motor vehicles | 117,027 | 98,536 | 18.8 |
| 521. Transport equipment, other than passenger motor vehicles, industrial | 80,836 | 58,513 | 38.2 |
| 522. Transport equipment, other than passenger motor vehicles, non-industrial | 36,191 | 40,023 | -9.6 |
| 53. Transport equipment, parts and accessories | 712,659 | 605,373 | 17.7 |
| 6. Consumer goods not elsewhere specified | 1,737,493 | 1,305,564 | 33.1 |
| 61. Consumer goods not elsewhere specified, durable | 424,288 | 330,452 | 28.4 |
| 62. Consumer goods not elsewhere specified, semi-durable | 1,091,030 | 804,470 | 35.6 |
| 63. Consumer goods not elsewhere specified, non-durable | 222,175 | 170,642 | 30.2 |
| 7. Goods not elsewhere specified | 115,860 | 148,025 | -21.7 |
| All groups | 8,000,449 | 5,819,468 | 37.5 |
| Classification | Description | Year level | Quarter level | Month level | Year 2026 sofar |
|---|---|---|---|---|---|
| SITC | Standard International Trade Classification (classification system is maintained by the United Nations) | ███ | ███ | ███ | ███ |
| BEC | The standard of statistical classification of BEC (Broad Economic Categories) is upheld by the UN and it is based on SITC-nomenclature. | ███ | ███ | ███ | ███ |
| NACE | National industrial classification based on Statistical Classification of Economic Activities in the European Community Nomenclature générale des Activités économiques dans les Communautés européennes | ███ | ███ | ███ | ███ |
| CPA | CPA = Classification of Products by Activities | ███ | ███ | ███ | ███ |
| CN | The Combined Nomenclature is the common nomenclature of the European Community. | ███ | ███ | ███ | ███ |