
| Export of goods from Finland and import to Finland | BEC (Broad Economic Categories) |
*) The standard of statistical classification of BEC (Broad Economic Categories) is upheld by the UN and it is based on SITC-nomenclature.


| 8 / 2026 | 8 / 2025 | Change from previous year's equal month % | ||
|---|---|---|---|---|
| 1,000 € | % | 1000 € | ||
| 1. Food and beverages | 12,228 | 3.4 | 11,239 | 8.8 |
| 11. Food and beverages, primary | 261 | 0.1 | 719 | -63.7 |
| 111. Food and beverages, primary, mainly for industry | 0 | 0.0 | 0 | .. |
| 112. Food and beverages, primary, mainly for household consumption | 261 | 0.1 | 719 | -63.7 |
| 12. Food and beverages, processed | 11,967 | 3.3 | 10,520 | 13.8 |
| 121. Food and beverages, processed, mainly for industry | 9,042 | 2.5 | 6,365 | 42.1 |
| 122. Food and beverages, processed, mainly for household consumption | 2,925 | 0.8 | 4,154 | -29.6 |
| 2. Industrial supplies not elsewhere specified | 187,593 | 51.8 | 164,547 | 14.0 |
| 21. Industrial supplies not elsewhere specified, primary | 48,903 | 13.5 | 11,965 | 308.7 |
| 22. Industrial supplies not elsewhere specified, processed | 138,690 | 38.3 | 152,582 | -9.1 |
| 3. Fuels and lubricants | 57 | 0.0 | 135 | -58.1 |
| 31. Fuels and lubricants, primary | 26 | 0.0 | 125 | -79.3 |
| 32. Fuels and lubricants, processed | 31 | 0.0 | 11 | 193.2 |
| 322. Fuels and lubricants, other | 31 | 0.0 | 11 | 193.2 |
| 4. Capital goods (except transport equipment), and parts and accessories thereof | 138,097 | 38.1 | 127,863 | 8.0 |
| 41. Capital goods (except transport equipment) | 70,612 | 19.5 | 66,826 | 5.7 |
| 42. Capital goods (except transport equipment), parts and accessories | 67,485 | 18.6 | 61,037 | 10.6 |
| 5. Transport equipment and parts and accessories thereof | 10,653 | 2.9 | 14,129 | -24.6 |
| 52. Transport equipment, other than passenger motor vehicles | 854 | 0.2 | 809 | 5.5 |
| 521. Transport equipment, other than passenger motor vehicles, industrial | 76 | 0.0 | 81 | -6.7 |
| 522. Transport equipment, other than passenger motor vehicles, non-industrial | 778 | 0.2 | 728 | 6.9 |
| 53. Transport equipment, parts and accessories | 9,799 | 2.7 | 13,320 | -26.4 |
| 6. Consumer goods not elsewhere specified | 13,576 | 3.7 | 7,828 | 73.4 |
| 61. Consumer goods not elsewhere specified, durable | 322 | 0.1 | 1,946 | -83.5 |
| 62. Consumer goods not elsewhere specified, semi-durable | 3,956 | 1.1 | 2,894 | 36.7 |
| 63. Consumer goods not elsewhere specified, non-durable | 9,297 | 2.6 | 2,987 | 211.2 |
| 7. Goods not elsewhere specified | 0 | 0.0 | 0 | .. |
| All groups | 362,203 | 100.0 | 325,741 | 11.2 |
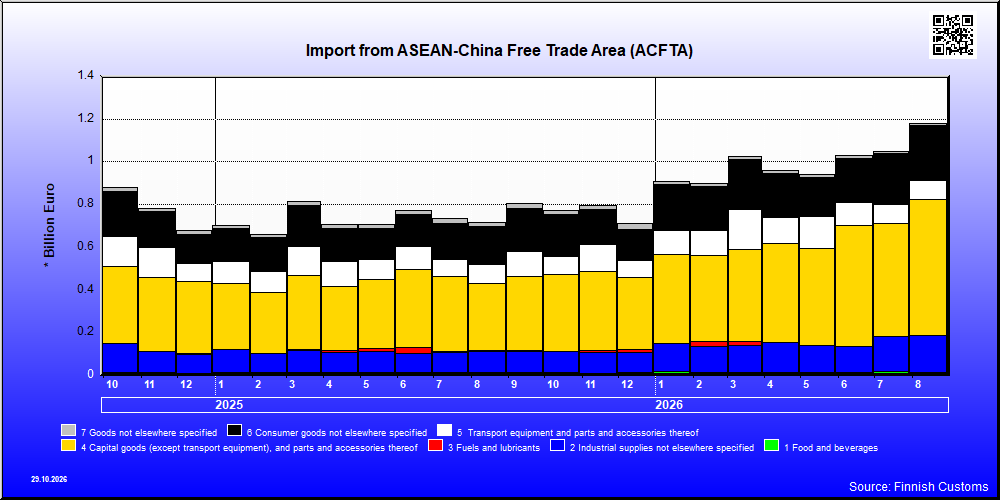
| 8 / 2026 | 8 / 2025 | Change from previous year's equal month % | ||
|---|---|---|---|---|
| 1,000 € | % | 1,000 € | ||
| 1. Food and beverages | 14,919 | 1.3 | 12,287 | 21.4 |
| 11. Food and beverages, primary | 2,609 | 0.2 | 2,105 | 24.0 |
| 111. Food and beverages, primary, mainly for industry | 265 | 0.0 | 130 | 103.5 |
| 112. Food and beverages, primary, mainly for household consumption | 2,345 | 0.2 | 1,975 | 18.7 |
| 12. Food and beverages, processed | 12,310 | 1.0 | 10,182 | 20.9 |
| 121. Food and beverages, processed, mainly for industry | 404 | 0.0 | 91 | 345.2 |
| 122. Food and beverages, processed, mainly for household consumption | 11,906 | 1.0 | 10,091 | 18.0 |
| 2. Industrial supplies not elsewhere specified | 170,494 | 14.5 | 99,040 | 72.1 |
| 21. Industrial supplies not elsewhere specified, primary | 8,400 | 0.7 | 6,478 | 29.7 |
| 22. Industrial supplies not elsewhere specified, processed | 162,094 | 13.7 | 92,562 | 75.1 |
| 3. Fuels and lubricants | 317 | 0.0 | 8,037 | -96.1 |
| 32. Fuels and lubricants, processed | 317 | 0.0 | 8,037 | -96.1 |
| 322. Fuels and lubricants, other | 317 | 0.0 | 8,037 | -96.1 |
| 4. Capital goods (except transport equipment), and parts and accessories thereof | 636,587 | 54.0 | 312,937 | 103.4 |
| 41. Capital goods (except transport equipment) | 450,779 | 38.2 | 235,587 | 91.3 |
| 42. Capital goods (except transport equipment), parts and accessories | 185,808 | 15.7 | 77,350 | 140.2 |
| 5. Transport equipment and parts and accessories thereof | 89,351 | 7.6 | 86,168 | 3.7 |
| 51. Passenger motor vehicles | 12,735 | 1.1 | 12,989 | -2.0 |
| 52. Transport equipment, other than passenger motor vehicles | 5,258 | 0.4 | 2,755 | 90.8 |
| 521. Transport equipment, other than passenger motor vehicles, industrial | 2,337 | 0.2 | 1,600 | 46.1 |
| 522. Transport equipment, other than passenger motor vehicles, non-industrial | 2,921 | 0.2 | 1,155 | 152.8 |
| 53. Transport equipment, parts and accessories | 71,359 | 6.0 | 70,424 | 1.3 |
| 6. Consumer goods not elsewhere specified | 258,503 | 21.9 | 177,144 | 45.9 |
| 61. Consumer goods not elsewhere specified, durable | 51,970 | 4.4 | 34,475 | 50.7 |
| 62. Consumer goods not elsewhere specified, semi-durable | 168,639 | 14.3 | 116,933 | 44.2 |
| 63. Consumer goods not elsewhere specified, non-durable | 37,895 | 3.2 | 25,736 | 47.2 |
| 7. Goods not elsewhere specified | 9,580 | 0.8 | 22,415 | -57.3 |
| All groups | 1,179,751 | 100.0 | 718,027 | 64.3 |
| Classification | Description | Year level | Quarter level | Month level | Year 2026 sofar |
|---|---|---|---|---|---|
| SITC | Standard International Trade Classification (classification system is maintained by the United Nations) | ███ | ███ | ███ | ███ |
| BEC | The standard of statistical classification of BEC (Broad Economic Categories) is upheld by the UN and it is based on SITC-nomenclature. | ███ | ███ | ███ | ███ |
| NACE | National industrial classification based on Statistical Classification of Economic Activities in the European Community Nomenclature générale des Activités économiques dans les Communautés européennes | ███ | ███ | ███ | ███ |
| CPA | CPA = Classification of Products by Activities | ███ | ███ | ███ | ███ |
| CN | The Combined Nomenclature is the common nomenclature of the European Community. | ███ | ███ | ███ | ███ |