
| Export of goods from Finland and import to Finland | BEC (Broad Economic Categories) |
*) The standard of statistical classification of BEC (Broad Economic Categories) is upheld by the UN and it is based on SITC-nomenclature.
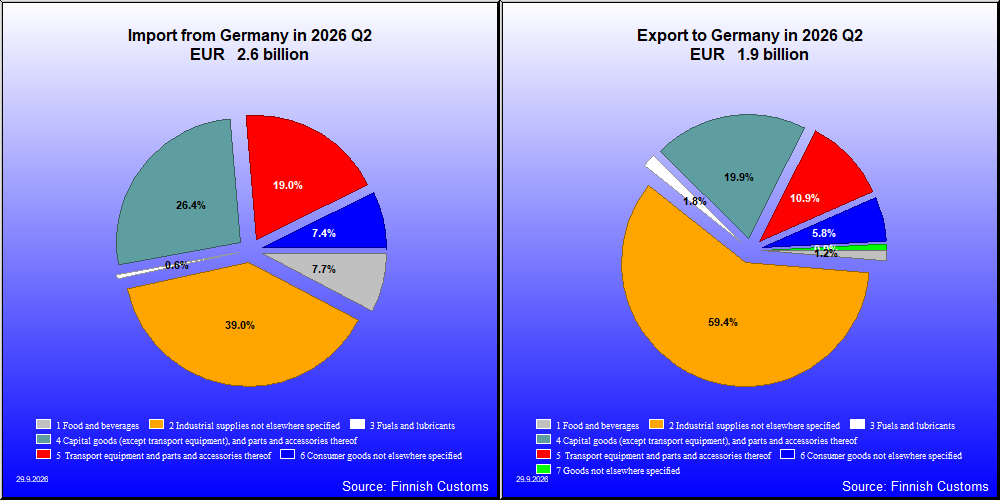

| Q2 / 2026 | Q2 / 2025 | Muutos edellisestä vastaavasta kaudesta % | ||
|---|---|---|---|---|
| 1,000 € | % | 1,000 € | ||
| 1. Food and beverages | 23,315 | 1.2 | 20,941 | 11.3 |
| 11. Food and beverages, primary | 7,864 | 0.4 | 4,839 | 62.5 |
| 111. Food and beverages, primary, mainly for industry | 1,166 | 0.1 | 1,375 | -15.2 |
| 112. Food and beverages, primary, mainly for household consumption | 6,697 | 0.4 | 3,464 | 93.3 |
| 12. Food and beverages, processed | 15,451 | 0.8 | 16,102 | -4.0 |
| 121. Food and beverages, processed, mainly for industry | 2,607 | 0.1 | 3,136 | -16.9 |
| 122. Food and beverages, processed, mainly for household consumption | 12,844 | 0.7 | 12,966 | -0.9 |
| 2. Industrial supplies not elsewhere specified | 1,124,107 | 59.3 | 969,896 | 15.9 |
| 21. Industrial supplies not elsewhere specified, primary | 56,190 | 3.0 | 51,973 | 8.1 |
| 22. Industrial supplies not elsewhere specified, processed | 1,067,917 | 56.4 | 917,923 | 16.3 |
| 3. Fuels and lubricants | 34,583 | 1.8 | 11,176 | 209.4 |
| 31. Fuels and lubricants, primary | 6,500 | 0.3 | 1,484 | 338.0 |
| 32. Fuels and lubricants, processed | 28,083 | 1.5 | 9,692 | 189.8 |
| 322. Fuels and lubricants, other | 28,083 | 1.5 | 9,692 | 189.8 |
| 4. Capital goods (except transport equipment), and parts and accessories thereof | 379,171 | 20.0 | 340,798 | 11.3 |
| 41. Capital goods (except transport equipment) | 302,642 | 16.0 | 268,518 | 12.7 |
| 42. Capital goods (except transport equipment), parts and accessories | 76,529 | 4.0 | 72,280 | 5.9 |
| 5. Transport equipment and parts and accessories thereof | 205,096 | 10.8 | 299,805 | -31.6 |
| 51. Passenger motor vehicles | 1,510 | 0.1 | 161,629 | -99.1 |
| 52. Transport equipment, other than passenger motor vehicles | 17,231 | 0.9 | 15,911 | 8.3 |
| 521. Transport equipment, other than passenger motor vehicles, industrial | 11,418 | 0.6 | 10,904 | 4.7 |
| 522. Transport equipment, other than passenger motor vehicles, non-industrial | 5,813 | 0.3 | 5,007 | 16.1 |
| 53. Transport equipment, parts and accessories | 186,354 | 9.8 | 122,265 | 52.4 |
| 6. Consumer goods not elsewhere specified | 110,693 | 5.8 | 120,787 | -8.4 |
| 61. Consumer goods not elsewhere specified, durable | 7,501 | 0.4 | 7,957 | -5.7 |
| 62. Consumer goods not elsewhere specified, semi-durable | 30,840 | 1.6 | 30,262 | 1.9 |
| 63. Consumer goods not elsewhere specified, non-durable | 72,352 | 3.8 | 82,568 | -12.4 |
| 7. Goods not elsewhere specified | 17,383 | 0.9 | 5,154 | 237.3 |
| All groups | 1,894,348 | 100.0 | 1,768,557 | 7.1 |

| Q2 / 2026 | Q2 / 2025 | Muutos edellisestä vastaavasta kaudesta % | ||
|---|---|---|---|---|
| 1,000 € | % | 1,000 € | ||
| 1. Food and beverages | 196,063 | 7.6 | 207,624 | -5.6 |
| 11. Food and beverages, primary | 19,423 | 0.8 | 16,691 | 16.4 |
| 111. Food and beverages, primary, mainly for industry | 2,966 | 0.1 | 1,274 | 132.8 |
| 112. Food and beverages, primary, mainly for household consumption | 16,458 | 0.6 | 15,417 | 6.7 |
| 12. Food and beverages, processed | 176,639 | 6.9 | 190,933 | -7.5 |
| 121. Food and beverages, processed, mainly for industry | 14,616 | 0.6 | 22,982 | -36.4 |
| 122. Food and beverages, processed, mainly for household consumption | 162,023 | 6.3 | 167,951 | -3.5 |
| 2. Industrial supplies not elsewhere specified | 990,452 | 38.6 | 834,536 | 18.7 |
| 21. Industrial supplies not elsewhere specified, primary | 115,880 | 4.5 | 126,416 | -8.3 |
| 22. Industrial supplies not elsewhere specified, processed | 874,572 | 34.0 | 708,120 | 23.5 |
| 3. Fuels and lubricants | 15,366 | 0.6 | 14,817 | 3.7 |
| 31. Fuels and lubricants, primary | 12 | 0.0 | 451 | -97.3 |
| 32. Fuels and lubricants, processed | 15,354 | 0.6 | 14,366 | 6.9 |
| 321. Fuels and lubricants, motor spirit | 0 | 0.0 | 0 | .. |
| 322. Fuels and lubricants, other | 15,354 | 0.6 | 14,366 | 6.9 |
| 4. Capital goods (except transport equipment), and parts and accessories thereof | 663,584 | 25.8 | 652,610 | 1.7 |
| 41. Capital goods (except transport equipment) | 382,701 | 14.9 | 377,791 | 1.3 |
| 42. Capital goods (except transport equipment), parts and accessories | 280,884 | 10.9 | 274,819 | 2.2 |
| 5. Transport equipment and parts and accessories thereof | 487,630 | 19.0 | 620,750 | -21.4 |
| 51. Passenger motor vehicles | 293,341 | 11.4 | 347,812 | -15.7 |
| 52. Transport equipment, other than passenger motor vehicles | 66,216 | 2.6 | 55,626 | 19.0 |
| 521. Transport equipment, other than passenger motor vehicles, industrial | 56,547 | 2.2 | 44,310 | 27.6 |
| 522. Transport equipment, other than passenger motor vehicles, non-industrial | 9,669 | 0.4 | 11,316 | -14.6 |
| 53. Transport equipment, parts and accessories | 128,073 | 5.0 | 217,312 | -41.1 |
| 6. Consumer goods not elsewhere specified | 191,344 | 7.4 | 210,437 | -9.1 |
| 61. Consumer goods not elsewhere specified, durable | 27,900 | 1.1 | 31,029 | -10.1 |
| 62. Consumer goods not elsewhere specified, semi-durable | 37,004 | 1.4 | 49,361 | -25.0 |
| 63. Consumer goods not elsewhere specified, non-durable | 126,440 | 4.9 | 130,046 | -2.8 |
| 7. Goods not elsewhere specified | 24,308 | 0.9 | 51,337 | -52.7 |
| All groups | 2,568,747 | 100.0 | 2,592,110 | -0.9 |
| Classification | Description | Year level | Quarter level | Month level | Year 2026 sofar |
|---|---|---|---|---|---|
| SITC | Standard International Trade Classification (classification system is maintained by the United Nations) | ███ | ███ | ███ | ███ |
| BEC | The standard of statistical classification of BEC (Broad Economic Categories) is upheld by the UN and it is based on SITC-nomenclature. | ███ | ███ | ███ | ███ |
| NACE | National industrial classification based on Statistical Classification of Economic Activities in the European Community Nomenclature générale des Activités économiques dans les Communautés européennes | ███ | ███ | ███ | ███ |
| CPA | CPA = Classification of Products by Activities | ███ | ███ | ███ | ███ |
| CN | The Combined Nomenclature is the common nomenclature of the European Community. | ███ | ███ | ███ | ███ |