
| Export of goods from Finland and import to Finland | BEC (Broad Economic Categories) |
*) The standard of statistical classification of BEC (Broad Economic Categories) is upheld by the UN and it is based on SITC-nomenclature.
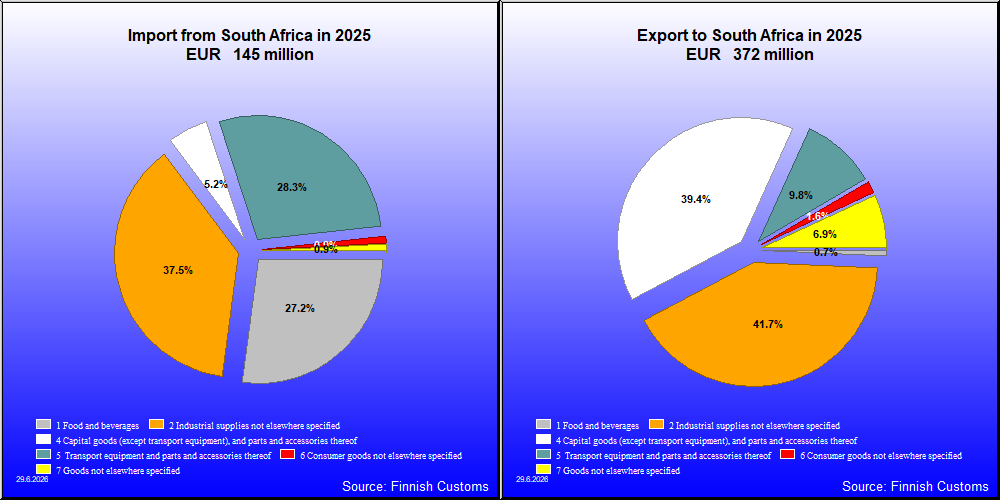

| 2021 | 2022 | 2023 | 2024 | 2025 | ||||||
|---|---|---|---|---|---|---|---|---|---|---|
| 1,000 € | % | 1,000 € | % | 1,000 € | % | 1,000 € | % | 1,000 € | % | |
| 1. Food and beverages | 497 | 0.1 | 980 | 0.2 | 739 | 0.2 | 1,141 | 0.3 | 2,446 | 0.7 |
| 11. Food and beverages, primary | 1 | 0.0 | 1 | 0.0 | 1 | 0.0 | 1 | 0.0 | 1 | 0.0 |
| 111. Food and beverages, primary, mainly for industry | 1 | 0.0 | 1 | 0.0 | 1 | 0.0 | 1 | 0.0 | 1 | 0.0 |
| 12. Food and beverages, processed | 496 | 0.1 | 979 | 0.2 | 738 | 0.2 | 1,140 | 0.3 | 2,445 | 0.7 |
| 121. Food and beverages, processed, mainly for industry | 141 | 0.0 | 435 | 0.1 | 586 | 0.1 | 587 | 0.2 | 634 | 0.2 |
| 122. Food and beverages, processed, mainly for household consumption | 355 | 0.1 | 543 | 0.1 | 153 | 0.0 | 553 | 0.1 | 1,812 | 0.5 |
| 2. Industrial supplies not elsewhere specified | 135,711 | 37.2 | 239,442 | 51.6 | 164,869 | 39.7 | 161,893 | 43.1 | 154,841 | 41.7 |
| 21. Industrial supplies not elsewhere specified, primary | 90 | 0.0 | 18 | 0.0 | 174 | 0.0 | 183 | 0.0 | 151 | 0.0 |
| 22. Industrial supplies not elsewhere specified, processed | 135,621 | 37.2 | 239,424 | 51.6 | 164,695 | 39.6 | 161,710 | 43.1 | 154,691 | 41.6 |
| 3. Fuels and lubricants | 33,260 | 9.1 | 31 | 0.0 | 18 | 0.0 | 87 | 0.0 | 44 | 0.0 |
| 31. Fuels and lubricants, primary | 23 | 0.0 | 22 | 0.0 | 16 | 0.0 | 79 | 0.0 | 36 | 0.0 |
| 32. Fuels and lubricants, processed | 33,237 | 9.1 | 9 | 0.0 | 2 | 0.0 | 8 | 0.0 | 8 | 0.0 |
| 321. Fuels and lubricants, motor spirit | 33,227 | 9.1 | ||||||||
| 322. Fuels and lubricants, other | 10 | 0.0 | 9 | 0.0 | 2 | 0.0 | 8 | 0.0 | 8 | 0.0 |
| 4. Capital goods (except transport equipment), and parts and accessories thereof | 173,268 | 47.5 | 183,793 | 39.6 | 203,071 | 48.9 | 173,124 | 46.1 | 146,414 | 39.4 |
| 41. Capital goods (except transport equipment) | 116,937 | 32.1 | 123,065 | 26.5 | 141,192 | 34.0 | 107,232 | 28.6 | 97,128 | 26.1 |
| 42. Capital goods (except transport equipment), parts and accessories | 56,332 | 15.5 | 60,728 | 13.1 | 61,879 | 14.9 | 65,891 | 17.5 | 49,285 | 13.3 |
| 5. Transport equipment and parts and accessories thereof | 16,857 | 4.6 | 28,000 | 6.0 | 38,254 | 9.2 | 23,960 | 6.4 | 36,408 | 9.8 |
| 52. Transport equipment, other than passenger motor vehicles | 15,963 | 4.4 | 25,267 | 5.4 | 35,944 | 8.6 | 22,816 | 6.1 | 15,735 | 4.2 |
| 521. Transport equipment, other than passenger motor vehicles, industrial | 15,877 | 4.4 | 25,234 | 5.4 | 35,904 | 8.6 | 22,802 | 6.1 | 15,659 | 4.2 |
| 522. Transport equipment, other than passenger motor vehicles, non-industrial | 86 | 0.0 | 33 | 0.0 | 40 | 0.0 | 14 | 0.0 | 76 | 0.0 |
| 53. Transport equipment, parts and accessories | 895 | 0.2 | 2,733 | 0.6 | 2,310 | 0.6 | 1,144 | 0.3 | 20,672 | 5.6 |
| 6. Consumer goods not elsewhere specified | 4,340 | 1.2 | 10,066 | 2.2 | 7,306 | 1.8 | 10,871 | 2.9 | 5,878 | 1.6 |
| 61. Consumer goods not elsewhere specified, durable | 2,457 | 0.7 | 1,352 | 0.3 | 2,229 | 0.5 | 2,510 | 0.7 | 1,618 | 0.4 |
| 62. Consumer goods not elsewhere specified, semi-durable | 895 | 0.2 | 2,539 | 0.5 | 962 | 0.2 | 1,333 | 0.4 | 1,052 | 0.3 |
| 63. Consumer goods not elsewhere specified, non-durable | 988 | 0.3 | 6,175 | 1.3 | 4,114 | 1.0 | 7,028 | 1.9 | 3,209 | 0.9 |
| 7. Goods not elsewhere specified | 577 | 0.2 | 1,942 | 0.4 | 1,431 | 0.3 | 4,420 | 1.2 | 25,688 | 6.9 |
| All groups | 364,510 | 100.0 | 464,253 | 100.0 | 415,688 | 100.0 | 375,495 | 100.0 | 371,720 | 100.0 |

| 2021 | 2022 | 2023 | 2024 | 2025 | ||||||
|---|---|---|---|---|---|---|---|---|---|---|
| 1,000 € | % | 1,000 € | % | 1,000 € | % | 1,000 € | % | 1,000 € | % | |
| 1. Food and beverages | 44,813 | 22.7 | 37,097 | 12.3 | 42,198 | 19.9 | 42,545 | 26.3 | 39,357 | 27.2 |
| 11. Food and beverages, primary | 37,160 | 18.8 | 28,951 | 9.6 | 35,915 | 17.0 | 36,741 | 22.7 | 34,618 | 23.9 |
| 111. Food and beverages, primary, mainly for industry | 60 | 0.0 | 4 | 0.0 | 27 | 0.0 | 41 | 0.0 | 30 | 0.0 |
| 112. Food and beverages, primary, mainly for household consumption | 37,100 | 18.8 | 28,948 | 9.6 | 35,888 | 16.9 | 36,700 | 22.7 | 34,588 | 23.9 |
| 12. Food and beverages, processed | 7,653 | 3.9 | 8,146 | 2.7 | 6,284 | 3.0 | 5,804 | 3.6 | 4,740 | 3.3 |
| 121. Food and beverages, processed, mainly for industry | 2 | 0.0 | 3 | 0.0 | 3 | 0.0 | 1 | 0.0 | ||
| 122. Food and beverages, processed, mainly for household consumption | 7,651 | 3.9 | 8,143 | 2.7 | 6,281 | 3.0 | 5,803 | 3.6 | 4,740 | 3.3 |
| 2. Industrial supplies not elsewhere specified | 67,058 | 34.0 | 78,290 | 26.0 | 89,207 | 42.1 | 92,275 | 57.1 | 54,290 | 37.5 |
| 21. Industrial supplies not elsewhere specified, primary | 34,553 | 17.5 | 24,612 | 8.2 | 48,556 | 22.9 | 64,458 | 39.9 | 27,827 | 19.2 |
| 22. Industrial supplies not elsewhere specified, processed | 32,505 | 16.5 | 53,678 | 17.8 | 40,651 | 19.2 | 27,817 | 17.2 | 26,463 | 18.3 |
| 3. Fuels and lubricants | 10 | 0.0 | 96,996 | 32.2 | 27,192 | 12.8 | 32 | 0.0 | 8 | 0.0 |
| 31. Fuels and lubricants, primary | 95,736 | 31.8 | 27,187 | 12.8 | ||||||
| 32. Fuels and lubricants, processed | 10 | 0.0 | 1,260 | 0.4 | 5 | 0.0 | 32 | 0.0 | 8 | 0.0 |
| 322. Fuels and lubricants, other | 10 | 0.0 | 1,260 | 0.4 | 5 | 0.0 | 32 | 0.0 | 8 | 0.0 |
| 4. Capital goods (except transport equipment), and parts and accessories thereof | 47,490 | 24.1 | 38,279 | 12.7 | 3,769 | 1.8 | 3,758 | 2.3 | 7,567 | 5.2 |
| 41. Capital goods (except transport equipment) | 45,564 | 23.1 | 35,267 | 11.7 | 1,216 | 0.6 | 1,173 | 0.7 | 3,725 | 2.6 |
| 42. Capital goods (except transport equipment), parts and accessories | 1,926 | 1.0 | 3,012 | 1.0 | 2,553 | 1.2 | 2,585 | 1.6 | 3,842 | 2.7 |
| 5. Transport equipment and parts and accessories thereof | 36,204 | 18.3 | 48,146 | 16.0 | 48,349 | 22.8 | 21,667 | 13.4 | 40,950 | 28.3 |
| 51. Passenger motor vehicles | 12,706 | 6.4 | 19,417 | 6.4 | 14,231 | 6.7 | 3,461 | 2.1 | 8,889 | 6.1 |
| 52. Transport equipment, other than passenger motor vehicles | 22,743 | 11.5 | 27,447 | 9.1 | 32,841 | 15.5 | 15,494 | 9.6 | 27,754 | 19.2 |
| 521. Transport equipment, other than passenger motor vehicles, industrial | 22,708 | 11.5 | 27,380 | 9.1 | 32,841 | 15.5 | 15,432 | 9.5 | 27,645 | 19.1 |
| 522. Transport equipment, other than passenger motor vehicles, non-industrial | 35 | 0.0 | 67 | 0.0 | 62 | 0.0 | 108 | 0.1 | ||
| 53. Transport equipment, parts and accessories | 755 | 0.4 | 1,282 | 0.4 | 1,277 | 0.6 | 2,718 | 1.7 | 4,308 | 3.0 |
| 6. Consumer goods not elsewhere specified | 1,749 | 0.9 | 2,415 | 0.8 | 1,119 | 0.5 | 1,319 | 0.8 | 1,282 | 0.9 |
| 61. Consumer goods not elsewhere specified, durable | 762 | 0.4 | 1,019 | 0.3 | 31 | 0.0 | 113 | 0.1 | 134 | 0.1 |
| 62. Consumer goods not elsewhere specified, semi-durable | 469 | 0.2 | 562 | 0.2 | 248 | 0.1 | 230 | 0.1 | 326 | 0.2 |
| 63. Consumer goods not elsewhere specified, non-durable | 518 | 0.3 | 834 | 0.3 | 840 | 0.4 | 976 | 0.6 | 821 | 0.6 |
| 7. Goods not elsewhere specified | 33 | 0.0 | 232 | 0.1 | 25 | 0.0 | 21 | 0.0 | 1,254 | 0.9 |
| All groups | 197,358 | 100.0 | 301,455 | 100.0 | 211,858 | 100.0 | 161,618 | 100.0 | 144,708 | 100.0 |
| Classification | Description | Year level | Quarter level | Month level | |
|---|---|---|---|---|---|
| SITC | Standard International Trade Classification (classification system is maintained by the United Nations) | ███ | ███ | ███ | |
| BEC | The standard of statistical classification of BEC (Broad Economic Categories) is upheld by the UN and it is based on SITC-nomenclature. | ███ | ███ | ███ | |
| NACE | National industrial classification based on Statistical Classification of Economic Activities in the European Community Nomenclature générale des Activités économiques dans les Communautés européennes | ███ | ███ | ███ | |
| CPA | CPA = Classification of Products by Activities | ███ | ███ | ███ | |
| CN | The Combined Nomenclature is the common nomenclature of the European Community. | ███ | ███ | ███ |