
| Export of goods from Finland and import to Finland | BEC (Broad Economic Categories) |
*) The standard of statistical classification of BEC (Broad Economic Categories) is upheld by the UN and it is based on SITC-nomenclature.
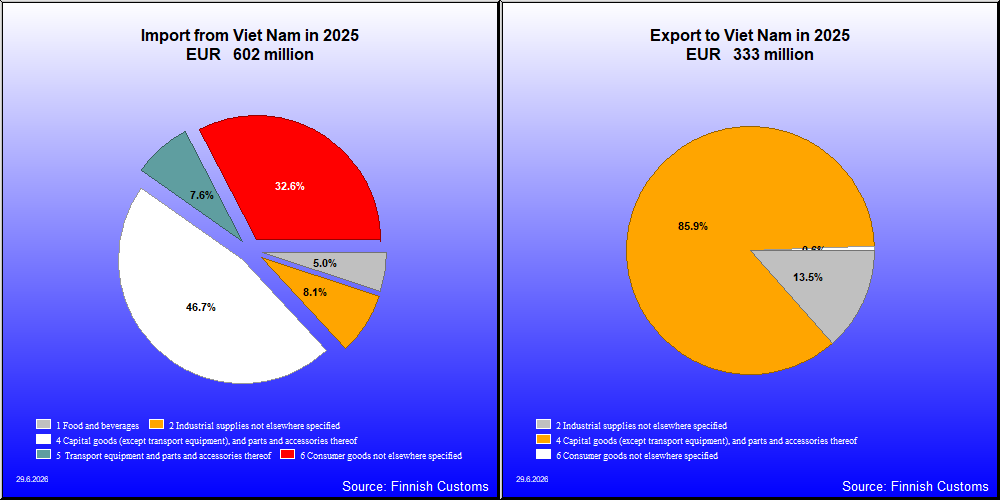
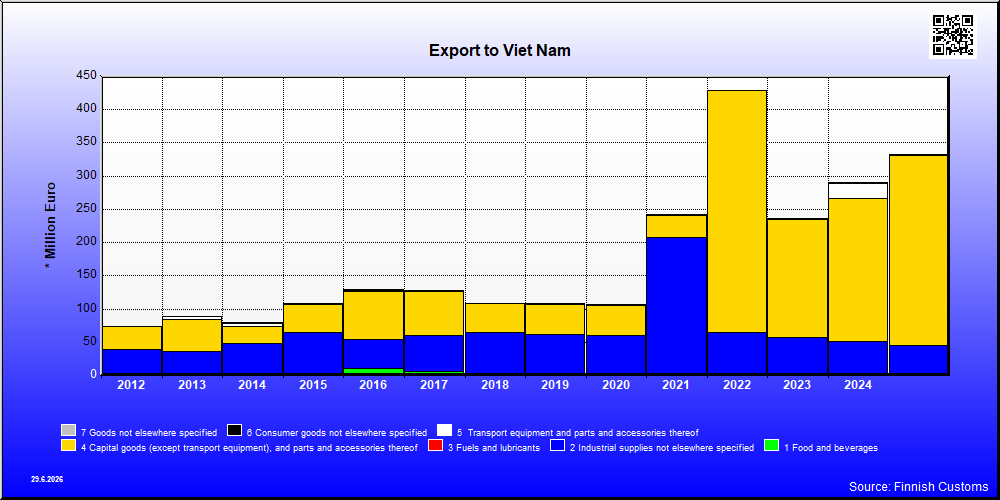
| 2021 | 2022 | 2023 | 2024 | 2025 | ||||||
|---|---|---|---|---|---|---|---|---|---|---|
| 1,000 € | % | 1,000 € | % | 1,000 € | % | 1,000 € | % | 1,000 € | % | |
| 1. Food and beverages | 771 | 0.3 | 1,241 | 0.3 | 356 | 0.2 | 439 | 0.2 | 998 | 0.3 |
| 12. Food and beverages, processed | 771 | 0.3 | 1,241 | 0.3 | 355 | 0.2 | 439 | 0.2 | 998 | 0.3 |
| 121. Food and beverages, processed, mainly for industry | 636 | 0.3 | 708 | 0.2 | 12 | 0.0 | 220 | 0.1 | 235 | 0.1 |
| 122. Food and beverages, processed, mainly for household consumption | 135 | 0.1 | 533 | 0.1 | 343 | 0.1 | 219 | 0.1 | 763 | 0.2 |
| 2. Industrial supplies not elsewhere specified | 206,695 | 85.5 | 64,188 | 14.9 | 57,277 | 24.3 | 50,038 | 17.2 | 44,855 | 13.5 |
| 21. Industrial supplies not elsewhere specified, primary | 31,024 | 12.8 | 13,478 | 3.1 | 7,454 | 3.2 | 7,577 | 2.6 | 2,602 | 0.8 |
| 22. Industrial supplies not elsewhere specified, processed | 175,671 | 72.7 | 50,711 | 11.8 | 49,823 | 21.1 | 42,462 | 14.6 | 42,253 | 12.7 |
| 3. Fuels and lubricants | 11 | 0.0 | 7 | 0.0 | 4 | 0.0 | 5 | 0.0 | 4 | 0.0 |
| 32. Fuels and lubricants, processed | 11 | 0.0 | 7 | 0.0 | 4 | 0.0 | 5 | 0.0 | 4 | 0.0 |
| 322. Fuels and lubricants, other | 11 | 0.0 | 7 | 0.0 | 4 | 0.0 | 5 | 0.0 | 4 | 0.0 |
| 4. Capital goods (except transport equipment), and parts and accessories thereof | 32,583 | 13.5 | 363,317 | 84.6 | 177,528 | 75.2 | 216,254 | 74.5 | 285,097 | 85.6 |
| 41. Capital goods (except transport equipment) | 23,669 | 9.8 | 343,236 | 79.9 | 150,686 | 63.8 | 160,115 | 55.1 | 61,743 | 18.5 |
| 42. Capital goods (except transport equipment), parts and accessories | 8,913 | 3.7 | 20,081 | 4.7 | 26,843 | 11.4 | 56,138 | 19.3 | 223,354 | 67.0 |
| 5. Transport equipment and parts and accessories thereof | 877 | 0.4 | 77 | 0.0 | 14 | 0.0 | 22,567 | 7.8 | 81 | 0.0 |
| 52. Transport equipment, other than passenger motor vehicles | 865 | 0.4 | 116 | 0.0 | 61 | 0.0 | ||||
| 521. Transport equipment, other than passenger motor vehicles, industrial | 865 | 0.4 | 116 | 0.0 | 61 | 0.0 | ||||
| 53. Transport equipment, parts and accessories | 12 | 0.0 | 77 | 0.0 | 14 | 0.0 | 22,451 | 7.7 | 20 | 0.0 |
| 6. Consumer goods not elsewhere specified | 754 | 0.3 | 568 | 0.1 | 907 | 0.4 | 1,144 | 0.4 | 2,128 | 0.6 |
| 61. Consumer goods not elsewhere specified, durable | 89 | 0.0 | 221 | 0.1 | 228 | 0.1 | 199 | 0.1 | 302 | 0.1 |
| 62. Consumer goods not elsewhere specified, semi-durable | 333 | 0.1 | 235 | 0.1 | 511 | 0.2 | 507 | 0.2 | 666 | 0.2 |
| 63. Consumer goods not elsewhere specified, non-durable | 331 | 0.1 | 113 | 0.0 | 168 | 0.1 | 438 | 0.2 | 1,160 | 0.3 |
| All groups | 241,690 | 100.0 | 429,398 | 100.0 | 236,086 | 100.0 | 290,446 | 100.0 | 333,163 | 100.0 |
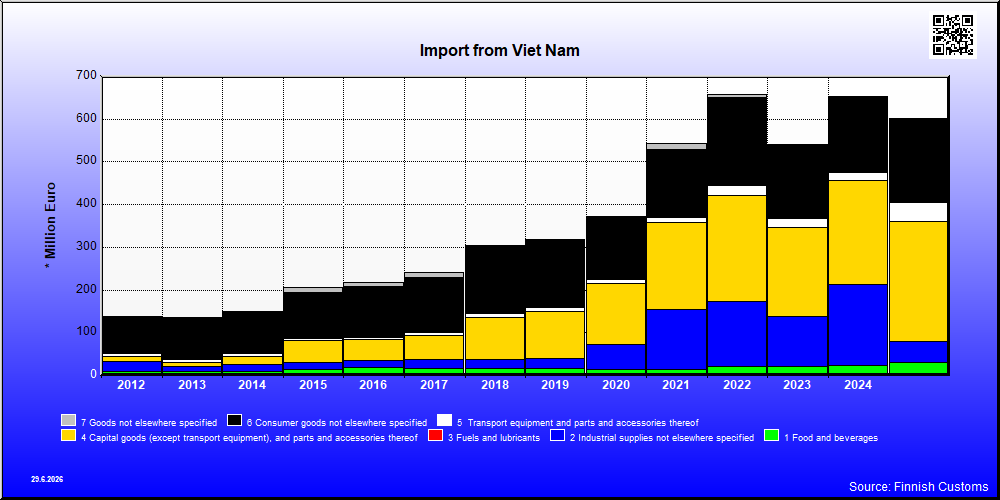
| 2021 | 2022 | 2023 | 2024 | 2025 | ||||||
|---|---|---|---|---|---|---|---|---|---|---|
| 1,000 € | % | 1,000 € | % | 1,000 € | % | 1,000 € | % | 1,000 € | % | |
| 1. Food and beverages | 14,459 | 2.7 | 21,045 | 3.2 | 20,793 | 3.8 | 22,752 | 3.5 | 30,002 | 5.0 |
| 11. Food and beverages, primary | 5,196 | 1.0 | 10,046 | 1.5 | 9,006 | 1.7 | 10,162 | 1.6 | 12,920 | 2.1 |
| 111. Food and beverages, primary, mainly for industry | 490 | 0.1 | 1,585 | 0.2 | 1,376 | 0.3 | 953 | 0.1 | 1,424 | 0.2 |
| 112. Food and beverages, primary, mainly for household consumption | 4,706 | 0.9 | 8,461 | 1.3 | 7,630 | 1.4 | 9,209 | 1.4 | 11,497 | 1.9 |
| 12. Food and beverages, processed | 9,263 | 1.7 | 10,999 | 1.7 | 11,786 | 2.2 | 12,590 | 1.9 | 17,081 | 2.8 |
| 121. Food and beverages, processed, mainly for industry | 130 | 0.0 | 97 | 0.0 | 18 | 0.0 | 19 | 0.0 | 18 | 0.0 |
| 122. Food and beverages, processed, mainly for household consumption | 9,134 | 1.7 | 10,902 | 1.7 | 11,769 | 2.2 | 12,571 | 1.9 | 17,063 | 2.8 |
| 2. Industrial supplies not elsewhere specified | 140,070 | 25.8 | 152,928 | 23.2 | 117,301 | 21.6 | 189,937 | 29.0 | 48,903 | 8.1 |
| 21. Industrial supplies not elsewhere specified, primary | 2,008 | 0.4 | 5,044 | 0.8 | 656 | 0.1 | 1,288 | 0.2 | 682 | 0.1 |
| 22. Industrial supplies not elsewhere specified, processed | 138,061 | 25.5 | 147,884 | 22.5 | 116,645 | 21.5 | 188,648 | 28.8 | 48,221 | 8.0 |
| 3. Fuels and lubricants | 19 | 0.0 | 31 | 0.0 | 133 | 0.0 | 50 | 0.0 | ||
| 31. Fuels and lubricants, primary | 69 | 0.0 | ||||||||
| 32. Fuels and lubricants, processed | 19 | 0.0 | 31 | 0.0 | 64 | 0.0 | 50 | 0.0 | ||
| 322. Fuels and lubricants, other | 19 | 0.0 | 31 | 0.0 | 64 | 0.0 | 50 | 0.0 | ||
| 4. Capital goods (except transport equipment), and parts and accessories thereof | 202,827 | 37.4 | 247,511 | 37.6 | 207,738 | 38.3 | 243,323 | 37.2 | 280,919 | 46.6 |
| 41. Capital goods (except transport equipment) | 186,725 | 34.4 | 242,573 | 36.8 | 203,369 | 37.5 | 224,763 | 34.4 | 251,312 | 41.7 |
| 42. Capital goods (except transport equipment), parts and accessories | 16,101 | 3.0 | 4,939 | 0.7 | 4,369 | 0.8 | 18,561 | 2.8 | 29,607 | 4.9 |
| 5. Transport equipment and parts and accessories thereof | 12,474 | 2.3 | 23,831 | 3.6 | 22,798 | 4.2 | 18,820 | 2.9 | 45,574 | 7.6 |
| 51. Passenger motor vehicles | 103 | 0.0 | 76 | 0.0 | 40 | 0.0 | ||||
| 52. Transport equipment, other than passenger motor vehicles | 1,127 | 0.2 | 776 | 0.1 | 1,261 | 0.2 | 1,290 | 0.2 | 2,126 | 0.4 |
| 521. Transport equipment, other than passenger motor vehicles, industrial | 216 | 0.0 | 178 | 0.0 | 80 | 0.0 | 84 | 0.0 | 122 | 0.0 |
| 522. Transport equipment, other than passenger motor vehicles, non-industrial | 911 | 0.2 | 598 | 0.1 | 1,181 | 0.2 | 1,205 | 0.2 | 2,004 | 0.3 |
| 53. Transport equipment, parts and accessories | 11,243 | 2.1 | 22,979 | 3.5 | 21,497 | 4.0 | 17,531 | 2.7 | 43,448 | 7.2 |
| 6. Consumer goods not elsewhere specified | 158,906 | 29.3 | 206,574 | 31.4 | 172,770 | 31.9 | 178,979 | 27.4 | 196,445 | 32.6 |
| 61. Consumer goods not elsewhere specified, durable | 18,241 | 3.4 | 19,763 | 3.0 | 13,175 | 2.4 | 20,105 | 3.1 | 21,744 | 3.6 |
| 62. Consumer goods not elsewhere specified, semi-durable | 127,957 | 23.6 | 174,888 | 26.6 | 149,444 | 27.6 | 148,888 | 22.8 | 163,418 | 27.1 |
| 63. Consumer goods not elsewhere specified, non-durable | 12,708 | 2.3 | 11,923 | 1.8 | 10,150 | 1.9 | 9,985 | 1.5 | 11,283 | 1.9 |
| 7. Goods not elsewhere specified | 13,349 | 2.5 | 6,674 | 1.0 | 480 | 0.1 | 336 | 0.1 | 411 | 0.1 |
| All groups | 542,084 | 100.0 | 658,583 | 100.0 | 541,911 | 100.0 | 654,280 | 100.0 | 602,304 | 100.0 |
| Classification | Description | Year level | Quarter level | Month level | |
|---|---|---|---|---|---|
| SITC | Standard International Trade Classification (classification system is maintained by the United Nations) | ███ | ███ | ███ | |
| BEC | The standard of statistical classification of BEC (Broad Economic Categories) is upheld by the UN and it is based on SITC-nomenclature. | ███ | ███ | ███ | |
| NACE | National industrial classification based on Statistical Classification of Economic Activities in the European Community Nomenclature générale des Activités économiques dans les Communautés européennes | ███ | ███ | ███ | |
| CPA | CPA = Classification of Products by Activities | ███ | ███ | ███ | |
| CN | The Combined Nomenclature is the common nomenclature of the European Community. | ███ | ███ | ███ |