
| Export of goods from Finland and import to Finland | BEC (Broad Economic Categories) |
*) The standard of statistical classification of BEC (Broad Economic Categories) is upheld by the UN and it is based on SITC-nomenclature.

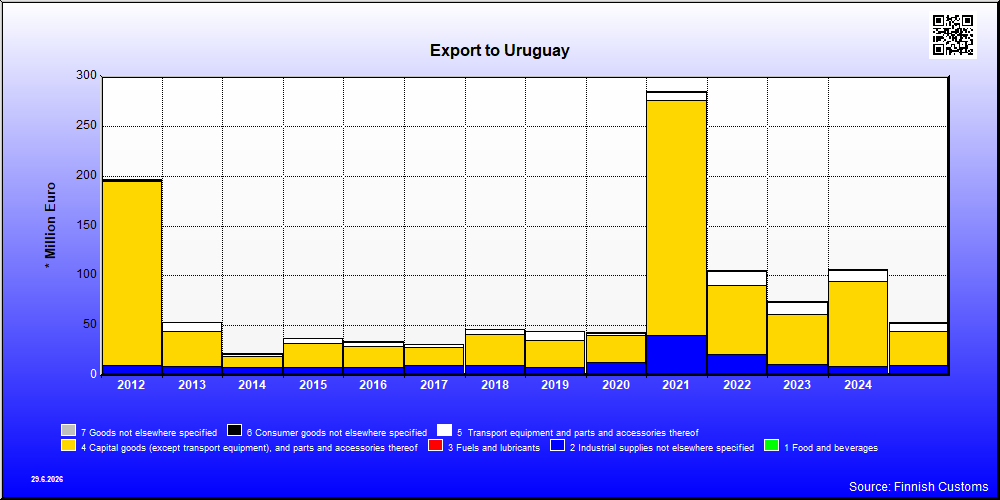
| 2021 | 2022 | 2023 | 2024 | 2025 | ||||||
|---|---|---|---|---|---|---|---|---|---|---|
| 1,000 € | % | 1,000 € | % | 1,000 € | % | 1,000 € | % | 1,000 € | % | |
| 1. Food and beverages | 95 | 0.0 | 26 | 0.0 | 36 | 0.0 | 36 | 0.0 | ||
| 12. Food and beverages, processed | 95 | 0.0 | 26 | 0.0 | 36 | 0.0 | 36 | 0.0 | ||
| 121. Food and beverages, processed, mainly for industry | 94 | 0.0 | 26 | 0.0 | 36 | 0.0 | 36 | 0.0 | ||
| 2. Industrial supplies not elsewhere specified | 40,494 | 14.2 | 21,425 | 20.3 | 10,800 | 14.5 | 8,675 | 8.2 | 10,175 | 19.2 |
| 21. Industrial supplies not elsewhere specified, primary | 163 | 0.1 | 151 | 0.1 | 690 | 0.9 | 53 | 0.1 | 180 | 0.3 |
| 22. Industrial supplies not elsewhere specified, processed | 40,331 | 14.2 | 21,274 | 20.2 | 10,110 | 13.6 | 8,621 | 8.1 | 9,995 | 18.8 |
| 3. Fuels and lubricants | 9 | 0.0 | 30 | 0.0 | 10 | 0.0 | 28 | 0.0 | 23 | 0.0 |
| 32. Fuels and lubricants, processed | 9 | 0.0 | 30 | 0.0 | 10 | 0.0 | 28 | 0.0 | 23 | 0.0 |
| 321. Fuels and lubricants, motor spirit | 8 | 0.0 | ||||||||
| 322. Fuels and lubricants, other | 1 | 0.0 | 30 | 0.0 | 10 | 0.0 | 28 | 0.0 | 23 | 0.0 |
| 4. Capital goods (except transport equipment), and parts and accessories thereof | 234,825 | 82.5 | 69,117 | 65.5 | 50,523 | 67.9 | 85,543 | 80.6 | 33,855 | 63.8 |
| 41. Capital goods (except transport equipment) | 59,404 | 20.9 | 29,260 | 27.7 | 26,552 | 35.7 | 69,710 | 65.7 | 12,352 | 23.3 |
| 42. Capital goods (except transport equipment), parts and accessories | 175,421 | 61.6 | 39,857 | 37.8 | 23,971 | 32.2 | 15,833 | 14.9 | 21,503 | 40.5 |
| 5. Transport equipment and parts and accessories thereof | 8,594 | 3.0 | 14,095 | 13.4 | 12,239 | 16.5 | 10,796 | 10.2 | 7,999 | 15.1 |
| 51. Passenger motor vehicles | 9 | 0.0 | ||||||||
| 52. Transport equipment, other than passenger motor vehicles | 7,713 | 2.7 | 12,897 | 12.2 | 11,295 | 15.2 | 10,118 | 9.5 | 7,270 | 13.7 |
| 521. Transport equipment, other than passenger motor vehicles, industrial | 7,706 | 2.7 | 12,342 | 11.7 | 11,252 | 15.1 | 10,118 | 9.5 | 7,270 | 13.7 |
| 522. Transport equipment, other than passenger motor vehicles, non-industrial | 10 | 0.0 | 555 | 0.5 | 42 | 0.1 | ||||
| 53. Transport equipment, parts and accessories | 882 | 0.3 | 1,189 | 1.1 | 944 | 1.3 | 678 | 0.6 | 729 | 1.4 |
| 6. Consumer goods not elsewhere specified | 579 | 0.2 | 868 | 0.8 | 778 | 1.0 | 1,007 | 0.9 | 956 | 1.8 |
| 61. Consumer goods not elsewhere specified, durable | 71 | 0.0 | 97 | 0.1 | 80 | 0.1 | 43 | 0.0 | 38 | 0.1 |
| 62. Consumer goods not elsewhere specified, semi-durable | 442 | 0.2 | 565 | 0.5 | 552 | 0.7 | 499 | 0.5 | 502 | 0.9 |
| 63. Consumer goods not elsewhere specified, non-durable | 66 | 0.0 | 205 | 0.2 | 146 | 0.2 | 465 | 0.4 | 416 | 0.8 |
| 7. Goods not elsewhere specified | 16 | 0.0 | 10 | 0.0 | 21 | 0.0 | ||||
| All groups | 284,597 | 100.0 | 105,577 | 100.0 | 74,395 | 100.0 | 106,085 | 100.0 | 53,029 | 100.0 |
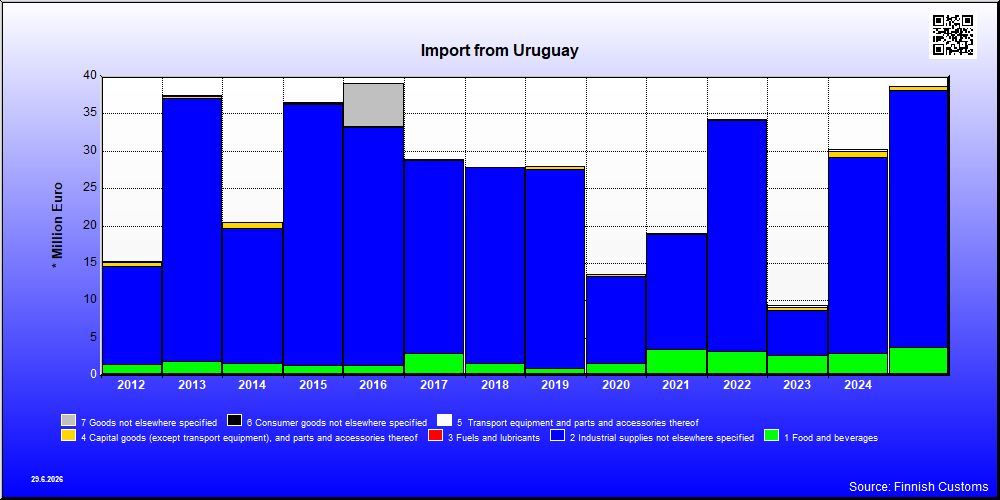
| 2021 | 2022 | 2023 | 2024 | 2025 | ||||||
|---|---|---|---|---|---|---|---|---|---|---|
| 1,000 € | % | 1,000 € | % | 1,000 € | % | 1,000 € | % | 1,000 € | % | |
| 1. Food and beverages | 3,417 | 18.0 | 3,226 | 9.4 | 2,681 | 28.7 | 2,972 | 9.8 | 3,758 | 9.7 |
| 11. Food and beverages, primary | 8 | 0.0 | 7 | 0.0 | 15 | 0.2 | 2 | 0.0 | 1 | 0.0 |
| 111. Food and beverages, primary, mainly for industry | 1 | 0.0 | ||||||||
| 112. Food and beverages, primary, mainly for household consumption | 8 | 0.0 | 7 | 0.0 | 14 | 0.1 | 2 | 0.0 | 1 | 0.0 |
| 12. Food and beverages, processed | 3,409 | 18.0 | 3,220 | 9.4 | 2,667 | 28.6 | 2,969 | 9.8 | 3,756 | 9.7 |
| 121. Food and beverages, processed, mainly for industry | 124 | 0.7 | 29 | 0.1 | 34 | 0.4 | 26 | 0.1 | 42 | 0.1 |
| 122. Food and beverages, processed, mainly for household consumption | 3,285 | 17.3 | 3,190 | 9.3 | 2,633 | 28.2 | 2,944 | 9.7 | 3,714 | 9.6 |
| 2. Industrial supplies not elsewhere specified | 15,439 | 81.5 | 30,834 | 90.0 | 6,069 | 65.1 | 26,159 | 86.4 | 34,366 | 88.9 |
| 21. Industrial supplies not elsewhere specified, primary | 32 | 0.2 | 16,875 | 49.3 | 68 | 0.7 | 93 | 0.3 | 9 | 0.0 |
| 22. Industrial supplies not elsewhere specified, processed | 15,407 | 81.3 | 13,959 | 40.8 | 6,001 | 64.3 | 26,066 | 86.1 | 34,357 | 88.9 |
| 4. Capital goods (except transport equipment), and parts and accessories thereof | 74 | 0.4 | 156 | 0.5 | 302 | 3.2 | 902 | 3.0 | 511 | 1.3 |
| 41. Capital goods (except transport equipment) | 12 | 0.1 | 123 | 0.4 | 194 | 2.1 | 396 | 1.3 | 510 | 1.3 |
| 42. Capital goods (except transport equipment), parts and accessories | 62 | 0.3 | 33 | 0.1 | 108 | 1.2 | 506 | 1.7 | 2 | 0.0 |
| 5. Transport equipment and parts and accessories thereof | 7 | 0.0 | 4 | 0.0 | 251 | 2.7 | 220 | 0.7 | 6 | 0.0 |
| 52. Transport equipment, other than passenger motor vehicles | 2 | 0.0 | 247 | 2.7 | 198 | 0.7 | ||||
| 521. Transport equipment, other than passenger motor vehicles, industrial | 2 | 0.0 | 247 | 2.7 | 198 | 0.7 | ||||
| 53. Transport equipment, parts and accessories | 7 | 0.0 | 1 | 0.0 | 4 | 0.0 | 22 | 0.1 | 6 | 0.0 |
| 6. Consumer goods not elsewhere specified | 17 | 0.1 | 31 | 0.1 | 23 | 0.2 | 32 | 0.1 | 4 | 0.0 |
| 61. Consumer goods not elsewhere specified, durable | 1 | 0.0 | 5 | 0.1 | 5 | 0.0 | ||||
| 62. Consumer goods not elsewhere specified, semi-durable | 2 | 0.0 | 3 | 0.0 | 17 | 0.2 | 22 | 0.1 | 2 | 0.0 |
| 63. Consumer goods not elsewhere specified, non-durable | 14 | 0.1 | 27 | 0.1 | 1 | 0.0 | 4 | 0.0 | 2 | 0.0 |
| 7. Goods not elsewhere specified | 1 | 0.0 | 2 | 0.0 | 2 | 0.0 | 2 | 0.0 | 2 | 0.0 |
| All groups | 18,955 | 100.0 | 34,252 | 100.0 | 9,329 | 100.0 | 30,286 | 100.0 | 38,647 | 100.0 |
| Classification | Description | Year level | Quarter level | Month level | |
|---|---|---|---|---|---|
| SITC | Standard International Trade Classification (classification system is maintained by the United Nations) | ███ | ███ | ███ | |
| BEC | The standard of statistical classification of BEC (Broad Economic Categories) is upheld by the UN and it is based on SITC-nomenclature. | ███ | ███ | ███ | |
| NACE | National industrial classification based on Statistical Classification of Economic Activities in the European Community Nomenclature générale des Activités économiques dans les Communautés européennes | ███ | ███ | ███ | |
| CPA | CPA = Classification of Products by Activities | ███ | ███ | ███ | |
| CN | The Combined Nomenclature is the common nomenclature of the European Community. | ███ | ███ | ███ |