
| Export of goods from Finland and import to Finland | BEC (Broad Economic Categories) |
*) The standard of statistical classification of BEC (Broad Economic Categories) is upheld by the UN and it is based on SITC-nomenclature.
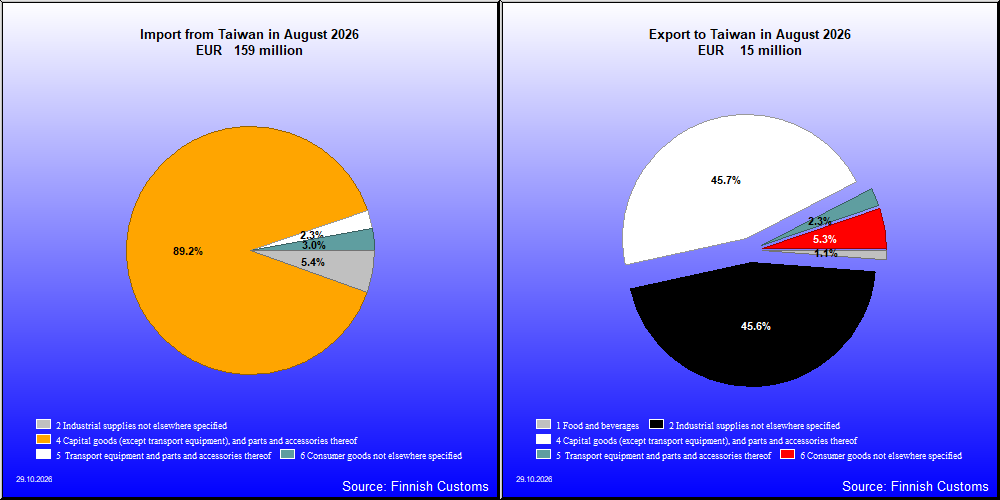
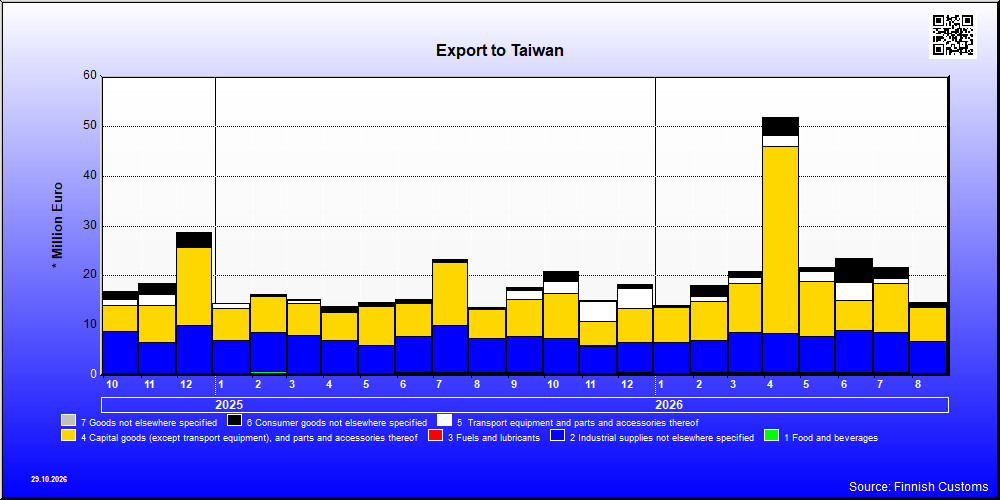

| 8 / 2026 | 8 / 2025 | Change from previous year's equal month % | ||
|---|---|---|---|---|
| 1,000 € | % | 1,000 € | ||
| 1. Food and beverages | 121 | 0.1 | 61 | 98.6 |
| 11. Food and beverages, primary | 6 | 0.0 | 0 | .. |
| 111. Food and beverages, primary, mainly for industry | 0 | 0.0 | 0 | .. |
| 112. Food and beverages, primary, mainly for household consumption | 5 | 0.0 | 0 | .. |
| 12. Food and beverages, processed | 116 | 0.1 | 61 | 90.1 |
| 121. Food and beverages, processed, mainly for industry | 52 | 0.0 | 22 | 136.9 |
| 122. Food and beverages, processed, mainly for household consumption | 63 | 0.0 | 39 | 63.5 |
| 2. Industrial supplies not elsewhere specified | 8,588 | 5.4 | 5,544 | 54.9 |
| 21. Industrial supplies not elsewhere specified, primary | 7 | 0.0 | 1 | 871.6 |
| 22. Industrial supplies not elsewhere specified, processed | 8,581 | 5.4 | 5,544 | 54.8 |
| 3. Fuels and lubricants | 4 | 0.0 | 12 | -66.6 |
| 32. Fuels and lubricants, processed | 4 | 0.0 | 12 | -66.6 |
| 322. Fuels and lubricants, other | 4 | 0.0 | 12 | -66.6 |
| 4. Capital goods (except transport equipment), and parts and accessories thereof | 141,693 | 89.2 | 32,858 | 331.2 |
| 41. Capital goods (except transport equipment) | 73,881 | 46.5 | 15,811 | 367.3 |
| 42. Capital goods (except transport equipment), parts and accessories | 67,812 | 42.7 | 17,047 | 297.8 |
| 5. Transport equipment and parts and accessories thereof | 3,730 | 2.3 | 2,712 | 37.6 |
| 52. Transport equipment, other than passenger motor vehicles | 382 | 0.2 | 286 | 33.2 |
| 521. Transport equipment, other than passenger motor vehicles, industrial | 8 | 0.0 | 4 | 131.5 |
| 522. Transport equipment, other than passenger motor vehicles, non-industrial | 373 | 0.2 | 283 | 32.0 |
| 53. Transport equipment, parts and accessories | 3,349 | 2.1 | 2,425 | 38.1 |
| 6. Consumer goods not elsewhere specified | 4,749 | 3.0 | 2,653 | 79.0 |
| 61. Consumer goods not elsewhere specified, durable | 1,070 | 0.7 | 413 | 159.3 |
| 62. Consumer goods not elsewhere specified, semi-durable | 3,035 | 1.9 | 2,033 | 49.3 |
| 63. Consumer goods not elsewhere specified, non-durable | 643 | 0.4 | 208 | 209.4 |
| 7. Goods not elsewhere specified | 33 | 0.0 | 26 | 27.3 |
| All groups | 158,919 | 100.0 | 43,866 | 262.3 |
| Classification | Description | Year level | Quarter level | Month level | Year 2026 sofar |
|---|---|---|---|---|---|
| SITC | Standard International Trade Classification (classification system is maintained by the United Nations) | ███ | ███ | ███ | ███ |
| BEC | The standard of statistical classification of BEC (Broad Economic Categories) is upheld by the UN and it is based on SITC-nomenclature. | ███ | ███ | ███ | ███ |
| NACE | National industrial classification based on Statistical Classification of Economic Activities in the European Community Nomenclature générale des Activités économiques dans les Communautés européennes | ███ | ███ | ███ | ███ |
| CPA | CPA = Classification of Products by Activities | ███ | ███ | ███ | ███ |
| CN | The Combined Nomenclature is the common nomenclature of the European Community. | ███ | ███ | ███ | ███ |