
| Export of goods from Finland and import to Finland | Trade Balance |

| Import 1,000 € | Export 1,000 € | Trade 1,000 € | Trade Balance 1,000 € | |
|---|---|---|---|---|
| 2019 Q1 | 3,834 | 10,771 | 14,605 | 6,937 |
| 2019 Q2 | 2,813 | 11,229 | 14,041 | 8,416 |
| 2019 Q3 | 3,863 | 11,274 | 15,137 | 7,411 |
| 2019 Q4 | 2,374 | 10,425 | 12,798 | 8,051 |
| 2020 Q1 | 3,541 | 7,332 | 10,873 | 3,791 |
| 2020 Q2 | 1,586 | 7,200 | 8,786 | 5,614 |
| 2020 Q3 | 2,745 | 8,436 | 11,181 | 5,691 |
| 2020 Q4 | 3,130 | 10,240 | 13,369 | 7,110 |
| 2021 Q1 | 3,194 | 10,164 | 13,358 | 6,970 |
| 2021 Q2 | 3,012 | 19,224 | 22,237 | 16,212 |
| 2021 Q3 | 3,668 | 15,347 | 19,015 | 11,680 |
| 2021 Q4 | 3,350 | 10,140 | 13,490 | 6,790 |
| 2022 Q1 | 3,445 | 6,649 | 10,094 | 3,204 |
| 2022 Q2 | 3,319 | 20,275 | 23,594 | 16,956 |
| 2022 Q3 | 3,713 | 11,420 | 15,133 | 7,707 |
| 2022 Q4 | 3,279 | 16,121 | 19,400 | 12,843 |
| 2023 Q1 | 4,909 | 10,546 | 15,455 | 5,637 |
| 2023 Q2 | 3,641 | 18,442 | 22,084 | 14,801 |
| 2023 Q3 | 4,343 | 4,436 | 8,779 | 93 |
| 2023 Q4 | 3,182 | 7,092 | 10,274 | 3,910 |
| 2024 Q1 | 6,131 | 7,244 | 13,375 | 1,113 |
| 2024 Q2 | 3,939 | 18,881 | 22,820 | 14,942 |
| 2024 Q3 | 4,821 | 9,754 | 14,574 | 4,933 |
| 2024 Q4 | 6,543 | 10,266 | 16,809 | 3,723 |
| 2025 Q1 | 5,688 | 11,872 | 17,560 | 6,184 |
| 2025 Q2 | 5,142 | 8,958 | 14,100 | 3,816 |
| 2025 Q3 | 6,468 | 12,858 | 19,326 | 6,390 |
| 2025 Q4 | 7,224 | 8,829 | 16,054 | 1,605 |
| 2026 Q1 | 13,248 | 9,588 | 22,836 | -3,660 |
| 2026 Q2 | 11,593 | 14,622 | 26,215 | 3,028 |
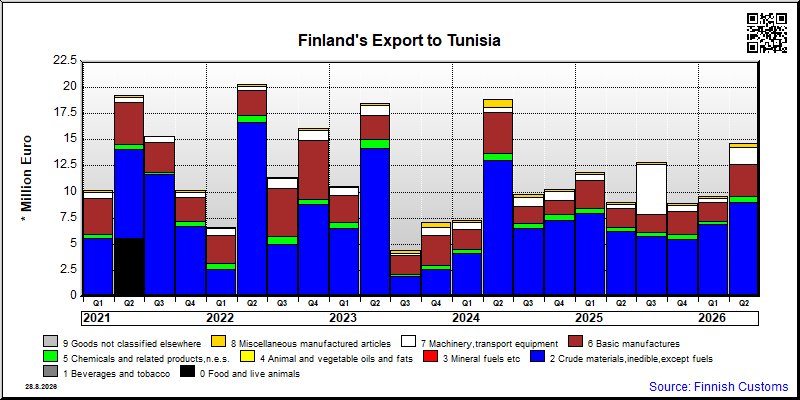
| Q2 / 2026 | Q2 / 2025 | Muutos edellisestä vastaavasta kaudesta % | ||
|---|---|---|---|---|
| 1,000 € | % | 1,000 € | ||
| 2. Crude materials,inedible,except fuels | 9,021 | 61.7 | 6,246 | 44.4 |
| 5. Chemicals and related products,n.e.s. | 522 | 3.6 | 366 | 42.6 |
| 6. Basic manufactures | 3,073 | 21.0 | 1,766 | 74.0 |
| 7. Machinery,transport equipment | 1,656 | 11.3 | 383 | 332.9 |
| 8. Miscellaneous manufactured articles | 349 | 2.4 | 197 | 77.2 |
| All groups combined | 14,622 | 100.0 | 8,958 | 63.2 |
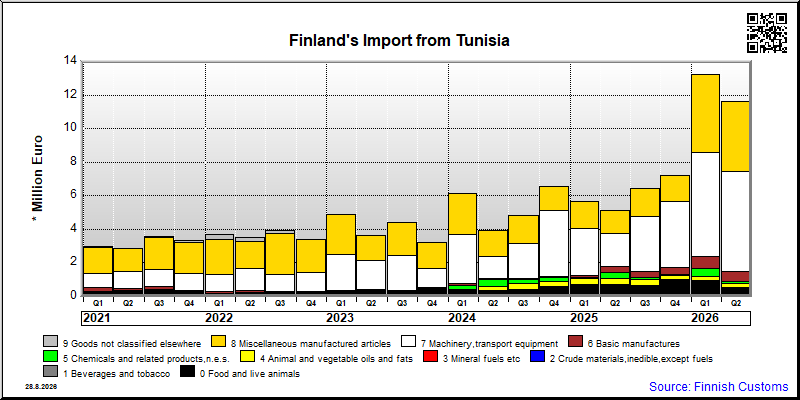
| Q2 / 2026 | Q2 / 2025 | Muutos edellisestä vastaavasta kaudesta % | ||
|---|---|---|---|---|
| 1,000 € | % | 1,000 € | ||
| 0. Food and live animals | 492 | 4.2 | 730 | -32.6 |
| 2. Crude materials,inedible,except fuels | 52 | 0.4 | 1 | .. |
| 4. Animal and vegetable oils and fats | 232 | 2.0 | 363 | -36.2 |
| 5. Chemicals and related products,n.e.s. | 142 | 1.2 | 331 | -57.0 |
| 6. Basic manufactures | 549 | 4.7 | 338 | 62.2 |
| 7. Machinery,transport equipment | 5,985 | 51.6 | 1,998 | 199.5 |
| 8. Miscellaneous manufactured articles | 4,142 | 35.7 | 1,373 | 201.7 |
| 9. Goods not classified elsewhere | 0 | 0.0 | 1 | -36.4 |
| All groups combined | 11,593 | 100.0 | 5,135 | 125.8 |
| Classification | Description | Year level | Quarter level | Month level | Year 2026 sofar |
|---|---|---|---|---|---|
| SITC | Standard International Trade Classification (classification system is maintained by the United Nations) | ███ | ███ | ███ | ███ |
| BEC | The standard of statistical classification of BEC (Broad Economic Categories) is upheld by the UN and it is based on SITC-nomenclature. | ███ | ███ | ███ | ███ |
| NACE | National industrial classification based on Statistical Classification of Economic Activities in the European Community Nomenclature générale des Activités économiques dans les Communautés européennes | ███ | ███ | ███ | ███ |
| CPA | CPA = Classification of Products by Activities | ███ | ███ | ███ | ███ |
| CN | The Combined Nomenclature is the common nomenclature of the European Community. | ███ | ███ | ███ | ███ |