
| Export of goods from Finland and import to Finland | BEC (Broad Economic Categories) |
*) The standard of statistical classification of BEC (Broad Economic Categories) is upheld by the UN and it is based on SITC-nomenclature.

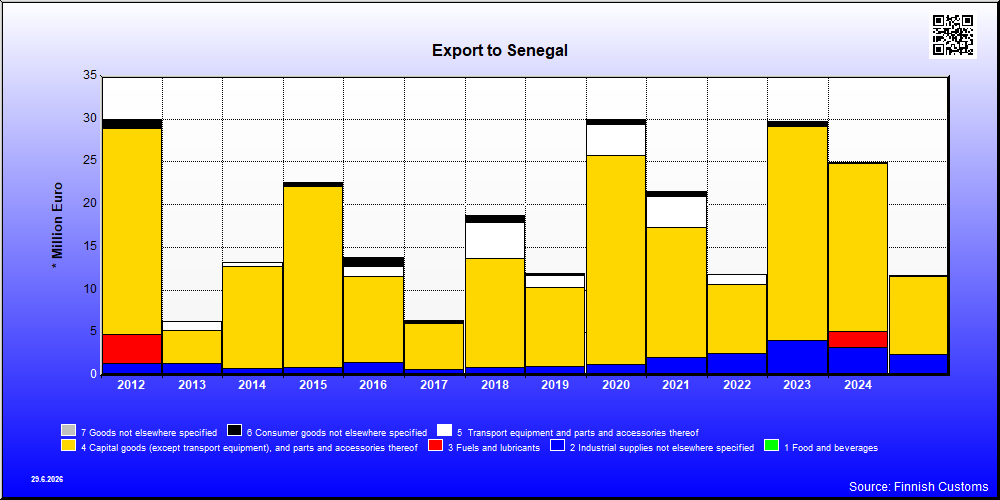
| 2021 | 2022 | 2023 | 2024 | 2025 | ||||||
|---|---|---|---|---|---|---|---|---|---|---|
| 1,000 € | % | 1,000 € | % | 1,000 € | % | 1,000 € | % | 1,000 € | % | |
| 2. Industrial supplies not elsewhere specified | 2,048 | 9.5 | 2,594 | 21.9 | 4,117 | 13.8 | 3,305 | 13.3 | 2,502 | 21.4 |
| 21. Industrial supplies not elsewhere specified, primary | 6 | 0.0 | 3 | 0.0 | ||||||
| 22. Industrial supplies not elsewhere specified, processed | 2,043 | 9.5 | 2,594 | 21.9 | 4,116 | 13.8 | 3,302 | 13.3 | 2,502 | 21.4 |
| 3. Fuels and lubricants | 11 | 0.0 | 1 | 0.0 | 1 | 0.0 | 1,870 | 7.5 | 9 | 0.1 |
| 31. Fuels and lubricants, primary | 9 | 0.0 | ||||||||
| 32. Fuels and lubricants, processed | 11 | 0.0 | 1 | 0.0 | 1 | 0.0 | 1,861 | 7.5 | 9 | 0.1 |
| 322. Fuels and lubricants, other | 11 | 0.0 | 1 | 0.0 | 1 | 0.0 | 1,861 | 7.5 | 9 | 0.1 |
| 4. Capital goods (except transport equipment), and parts and accessories thereof | 15,281 | 71.0 | 8,062 | 68.0 | 25,077 | 84.2 | 19,623 | 78.8 | 9,026 | 77.4 |
| 41. Capital goods (except transport equipment) | 6,759 | 31.4 | 6,291 | 53.0 | 10,212 | 34.3 | 15,298 | 61.5 | 7,199 | 61.7 |
| 42. Capital goods (except transport equipment), parts and accessories | 8,521 | 39.6 | 1,771 | 14.9 | 14,866 | 49.9 | 4,325 | 17.4 | 1,827 | 15.7 |
| 5. Transport equipment and parts and accessories thereof | 3,584 | 16.7 | 1,187 | 10.0 | 65 | 0.2 | 60 | 0.2 | 100 | 0.9 |
| 51. Passenger motor vehicles | 4 | 0.0 | ||||||||
| 52. Transport equipment, other than passenger motor vehicles | 3,513 | 16.3 | 1,175 | 9.9 | 35 | 0.1 | 13 | 0.1 | 18 | 0.2 |
| 521. Transport equipment, other than passenger motor vehicles, industrial | 3,510 | 16.3 | 1,173 | 9.9 | 33 | 0.1 | 13 | 0.1 | 15 | 0.1 |
| 522. Transport equipment, other than passenger motor vehicles, non-industrial | 3 | 0.0 | 1 | 0.0 | 2 | 0.0 | 3 | 0.0 | ||
| 53. Transport equipment, parts and accessories | 71 | 0.3 | 12 | 0.1 | 25 | 0.1 | 47 | 0.2 | 82 | 0.7 |
| 6. Consumer goods not elsewhere specified | 596 | 2.8 | 19 | 0.2 | 517 | 1.7 | 34 | 0.1 | 30 | 0.3 |
| 61. Consumer goods not elsewhere specified, durable | 14 | 0.1 | 8 | 0.1 | 75 | 0.3 | 5 | 0.0 | 8 | 0.1 |
| 62. Consumer goods not elsewhere specified, semi-durable | 26 | 0.1 | 5 | 0.0 | 17 | 0.1 | 4 | 0.0 | 7 | 0.1 |
| 63. Consumer goods not elsewhere specified, non-durable | 556 | 2.6 | 6 | 0.0 | 424 | 1.4 | 24 | 0.1 | 16 | 0.1 |
| All groups | 21,520 | 100.0 | 11,863 | 100.0 | 29,776 | 100.0 | 24,890 | 100.0 | 11,668 | 100.0 |
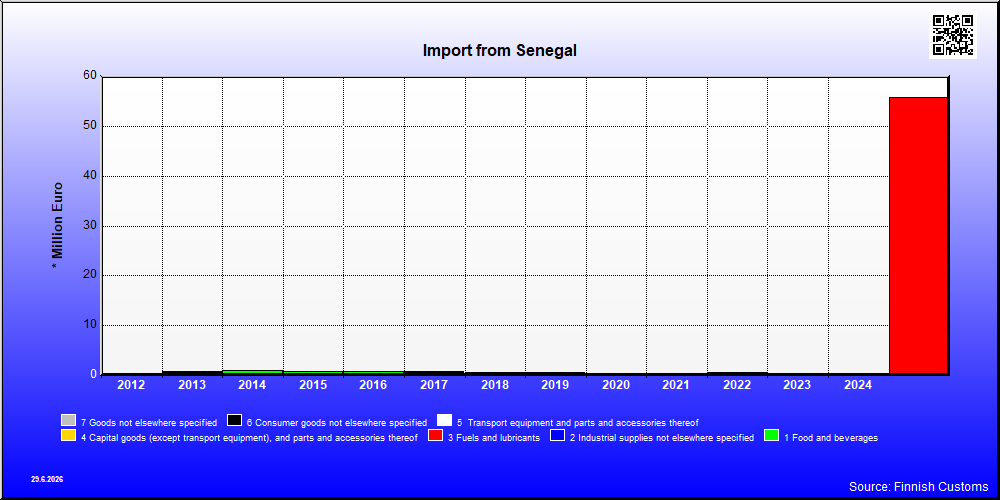
| 2021 | 2022 | 2023 | 2024 | 2025 | ||||||
|---|---|---|---|---|---|---|---|---|---|---|
| 1,000 € | % | 1,000 € | % | 1,000 € | % | 1,000 € | % | 1,000 € | % | |
| 1. Food and beverages | 184 | 71.8 | 147 | 25.8 | 85 | 62.1 | 140 | 38.7 | 290 | 0.5 |
| 11. Food and beverages, primary | 177 | 69.1 | 143 | 25.2 | 83 | 60.7 | 135 | 37.4 | 289 | 0.5 |
| 111. Food and beverages, primary, mainly for industry | 2 | 0.7 | ||||||||
| 112. Food and beverages, primary, mainly for household consumption | 177 | 69.1 | 143 | 25.2 | 83 | 60.6 | 133 | 36.7 | 289 | 0.5 |
| 12. Food and beverages, processed | 7 | 2.7 | 3 | 0.6 | 3 | 2.3 | 5 | 1.3 | 1 | 0.0 |
| 121. Food and beverages, processed, mainly for industry | 3 | 1.0 | 2 | 0.3 | 1 | 0.2 | ||||
| 122. Food and beverages, processed, mainly for household consumption | 4 | 1.7 | 2 | 0.3 | 3 | 2.2 | 4 | 1.2 | 1 | 0.0 |
| 2. Industrial supplies not elsewhere specified | 20 | 7.7 | 2 | 0.3 | 1 | 0.8 | 32 | 8.8 | 88 | 0.2 |
| 21. Industrial supplies not elsewhere specified, primary | 1 | 0.5 | 1 | 0.1 | 32 | 8.7 | 86 | 0.2 | ||
| 22. Industrial supplies not elsewhere specified, processed | 18 | 7.2 | 1 | 0.2 | 1 | 0.8 | 2 | 0.0 | ||
| 3. Fuels and lubricants | 55,432 | 99.3 | ||||||||
| 31. Fuels and lubricants, primary | 55,432 | 99.3 | ||||||||
| 4. Capital goods (except transport equipment), and parts and accessories thereof | 6 | 2.5 | 403 | 70.7 | 24 | 17.3 | 177 | 49.1 | 10 | 0.0 |
| 41. Capital goods (except transport equipment) | 5 | 1.8 | 395 | 69.3 | 3 | 2.3 | 120 | 33.2 | 5 | 0.0 |
| 42. Capital goods (except transport equipment), parts and accessories | 2 | 0.6 | 8 | 1.4 | 21 | 15.0 | 57 | 15.8 | 5 | 0.0 |
| 5. Transport equipment and parts and accessories thereof | 1 | 0.7 | 9 | 2.4 | 11 | 0.0 | ||||
| 53. Transport equipment, parts and accessories | 1 | 0.7 | 9 | 2.4 | 11 | 0.0 | ||||
| 6. Consumer goods not elsewhere specified | 45 | 17.4 | 15 | 2.6 | 25 | 18.5 | 3 | 0.8 | 9 | 0.0 |
| 61. Consumer goods not elsewhere specified, durable | 1 | 0.5 | ||||||||
| 62. Consumer goods not elsewhere specified, semi-durable | 44 | 17.2 | 14 | 2.5 | 12 | 8.5 | 3 | 0.8 | 2 | 0.0 |
| 63. Consumer goods not elsewhere specified, non-durable | 13 | 9.5 | 1 | 0.2 | 7 | 0.0 | ||||
| 7. Goods not elsewhere specified | 2 | 0.7 | 4 | 0.8 | 1 | 0.5 | 1 | 0.2 | ||
| All groups | 256 | 100.0 | 570 | 100.0 | 137 | 100.0 | 361 | 100.0 | 55,840 | 100.0 |
| Classification | Description | Year level | Quarter level | Month level | |
|---|---|---|---|---|---|
| SITC | Standard International Trade Classification (classification system is maintained by the United Nations) | ███ | |||
| BEC | The standard of statistical classification of BEC (Broad Economic Categories) is upheld by the UN and it is based on SITC-nomenclature. | ███ | |||
| NACE | National industrial classification based on Statistical Classification of Economic Activities in the European Community Nomenclature générale des Activités économiques dans les Communautés européennes | ███ | |||
| CPA | CPA = Classification of Products by Activities | ███ | |||
| CN | The Combined Nomenclature is the common nomenclature of the European Community. | ███ |