
| Export of goods from Finland and import to Finland | BEC (Broad Economic Categories) |
*) The standard of statistical classification of BEC (Broad Economic Categories) is upheld by the UN and it is based on SITC-nomenclature.
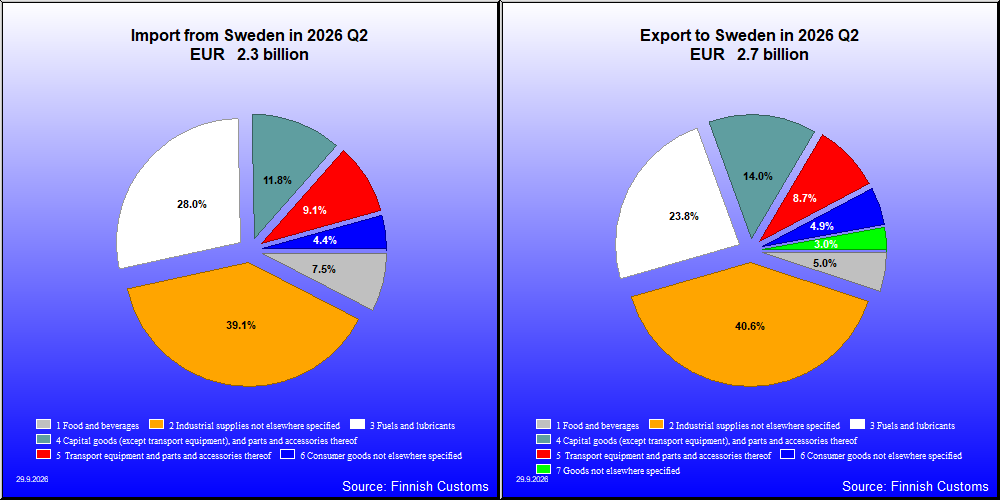
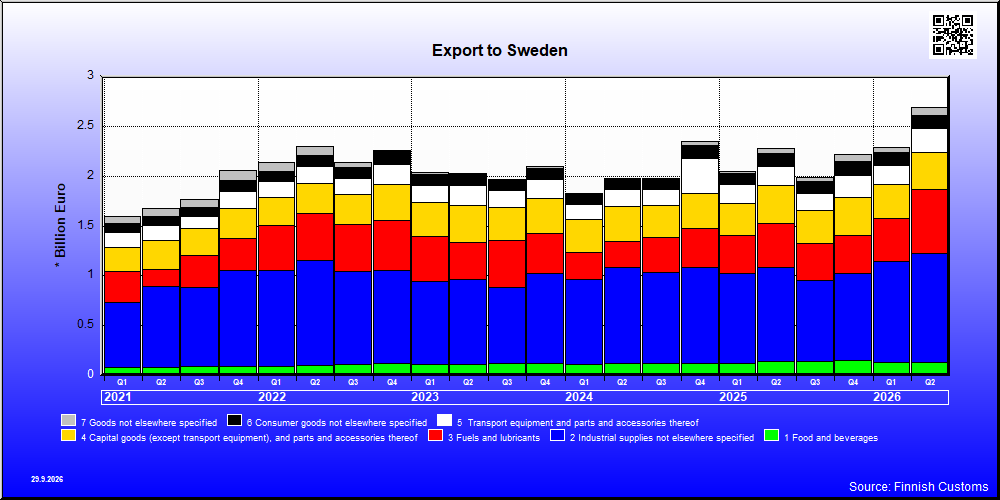
| Q2 / 2026 | Q2 / 2025 | Muutos edellisestä vastaavasta kaudesta % | ||
|---|---|---|---|---|
| 1,000 € | % | 1,000 € | ||
| 1. Food and beverages | 134,165 | 5.0 | 136,016 | -1.4 |
| 11. Food and beverages, primary | 30,951 | 1.2 | 27,163 | 13.9 |
| 111. Food and beverages, primary, mainly for industry | 1,206 | 0.0 | 338 | 256.5 |
| 112. Food and beverages, primary, mainly for household consumption | 29,745 | 1.1 | 26,825 | 10.9 |
| 12. Food and beverages, processed | 103,214 | 3.9 | 108,853 | -5.2 |
| 121. Food and beverages, processed, mainly for industry | 10,015 | 0.4 | 12,697 | -21.1 |
| 122. Food and beverages, processed, mainly for household consumption | 93,199 | 3.5 | 96,156 | -3.1 |
| 2. Industrial supplies not elsewhere specified | 1,080,159 | 40.5 | 952,595 | 13.4 |
| 21. Industrial supplies not elsewhere specified, primary | 201,819 | 7.6 | 190,264 | 6.1 |
| 22. Industrial supplies not elsewhere specified, processed | 878,340 | 32.9 | 762,332 | 15.2 |
| 3. Fuels and lubricants | 639,627 | 24.0 | 436,090 | 46.7 |
| 31. Fuels and lubricants, primary | 916 | 0.0 | 3,342 | -72.6 |
| 32. Fuels and lubricants, processed | 638,711 | 23.9 | 432,749 | 47.6 |
| 321. Fuels and lubricants, motor spirit | 142,665 | 5.3 | 96,827 | 47.3 |
| 322. Fuels and lubricants, other | 496,046 | 18.6 | 335,921 | 47.7 |
| 4. Capital goods (except transport equipment), and parts and accessories thereof | 372,457 | 14.0 | 383,918 | -3.0 |
| 41. Capital goods (except transport equipment) | 272,774 | 10.2 | 291,612 | -6.5 |
| 42. Capital goods (except transport equipment), parts and accessories | 99,683 | 3.7 | 92,307 | 8.0 |
| 5. Transport equipment and parts and accessories thereof | 231,205 | 8.7 | 184,760 | 25.1 |
| 51. Passenger motor vehicles | 5,000 | 0.2 | 2,982 | 67.7 |
| 52. Transport equipment, other than passenger motor vehicles | 145,449 | 5.5 | 101,702 | 43.0 |
| 521. Transport equipment, other than passenger motor vehicles, industrial | 129,631 | 4.9 | 87,672 | 47.9 |
| 522. Transport equipment, other than passenger motor vehicles, non-industrial | 15,818 | 0.6 | 14,030 | 12.7 |
| 53. Transport equipment, parts and accessories | 80,756 | 3.0 | 80,076 | 0.8 |
| 6. Consumer goods not elsewhere specified | 131,392 | 4.9 | 130,371 | 0.8 |
| 61. Consumer goods not elsewhere specified, durable | 16,536 | 0.6 | 18,548 | -10.8 |
| 62. Consumer goods not elsewhere specified, semi-durable | 59,742 | 2.2 | 58,482 | 2.2 |
| 63. Consumer goods not elsewhere specified, non-durable | 55,114 | 2.1 | 53,342 | 3.3 |
| 7. Goods not elsewhere specified | 79,142 | 3.0 | 58,855 | 34.5 |
| All groups | 2,668,147 | 100.0 | 2,282,606 | 16.9 |

| Q2 / 2026 | Q2 / 2025 | Muutos edellisestä vastaavasta kaudesta % | ||
|---|---|---|---|---|
| 1,000 € | % | 1,000 € | ||
| 1. Food and beverages | 172,061 | 7.4 | 190,784 | -9.8 |
| 11. Food and beverages, primary | 19,811 | 0.9 | 22,267 | -11.0 |
| 111. Food and beverages, primary, mainly for industry | 1,586 | 0.1 | 2,386 | -33.5 |
| 112. Food and beverages, primary, mainly for household consumption | 18,225 | 0.8 | 19,881 | -8.3 |
| 12. Food and beverages, processed | 152,251 | 6.6 | 168,517 | -9.7 |
| 121. Food and beverages, processed, mainly for industry | 8,391 | 0.4 | 6,583 | 27.5 |
| 122. Food and beverages, processed, mainly for household consumption | 143,859 | 6.2 | 161,934 | -11.2 |
| 2. Industrial supplies not elsewhere specified | 904,671 | 39.1 | 717,262 | 26.1 |
| 21. Industrial supplies not elsewhere specified, primary | 144,806 | 6.3 | 181,058 | -20.0 |
| 22. Industrial supplies not elsewhere specified, processed | 759,865 | 32.8 | 536,204 | 41.7 |
| 3. Fuels and lubricants | 648,099 | 28.0 | 412,365 | 57.2 |
| 31. Fuels and lubricants, primary | 1,407 | 0.1 | 1,414 | -0.5 |
| 32. Fuels and lubricants, processed | 646,692 | 27.9 | 410,951 | 57.4 |
| 321. Fuels and lubricants, motor spirit | 154,368 | 6.7 | 110,644 | 39.5 |
| 322. Fuels and lubricants, other | 492,324 | 21.3 | 300,307 | 63.9 |
| 4. Capital goods (except transport equipment), and parts and accessories thereof | 275,702 | 11.9 | 327,835 | -15.9 |
| 41. Capital goods (except transport equipment) | 172,050 | 7.4 | 196,485 | -12.4 |
| 42. Capital goods (except transport equipment), parts and accessories | 103,652 | 4.5 | 131,351 | -21.1 |
| 5. Transport equipment and parts and accessories thereof | 211,140 | 9.1 | 269,461 | -21.6 |
| 51. Passenger motor vehicles | 67,418 | 2.9 | 121,377 | -44.5 |
| 52. Transport equipment, other than passenger motor vehicles | 98,304 | 4.2 | 95,212 | 3.2 |
| 521. Transport equipment, other than passenger motor vehicles, industrial | 93,520 | 4.0 | 83,249 | 12.3 |
| 522. Transport equipment, other than passenger motor vehicles, non-industrial | 4,784 | 0.2 | 11,962 | -60.0 |
| 53. Transport equipment, parts and accessories | 45,419 | 2.0 | 52,872 | -14.1 |
| 6. Consumer goods not elsewhere specified | 102,036 | 4.4 | 171,850 | -40.6 |
| 61. Consumer goods not elsewhere specified, durable | 23,546 | 1.0 | 34,214 | -31.2 |
| 62. Consumer goods not elsewhere specified, semi-durable | 21,675 | 0.9 | 54,091 | -59.9 |
| 63. Consumer goods not elsewhere specified, non-durable | 56,815 | 2.5 | 83,545 | -32.0 |
| 7. Goods not elsewhere specified | 1,087 | 0.0 | 62,676 | -98.3 |
| All groups | 2,314,797 | 100.0 | 2,152,234 | 7.6 |
| Classification | Description | Year level | Quarter level | Month level | Year 2026 sofar |
|---|---|---|---|---|---|
| SITC | Standard International Trade Classification (classification system is maintained by the United Nations) | ███ | ███ | ███ | ███ |
| BEC | The standard of statistical classification of BEC (Broad Economic Categories) is upheld by the UN and it is based on SITC-nomenclature. | ███ | ███ | ███ | ███ |
| NACE | National industrial classification based on Statistical Classification of Economic Activities in the European Community Nomenclature générale des Activités économiques dans les Communautés européennes | ███ | ███ | ███ | ███ |
| CPA | CPA = Classification of Products by Activities | ███ | ███ | ███ | ███ |
| CN | The Combined Nomenclature is the common nomenclature of the European Community. | ███ | ███ | ███ | ███ |