
| Export of goods from Finland and import to Finland | BEC (Broad Economic Categories) |
*) The standard of statistical classification of BEC (Broad Economic Categories) is upheld by the UN and it is based on SITC-nomenclature.
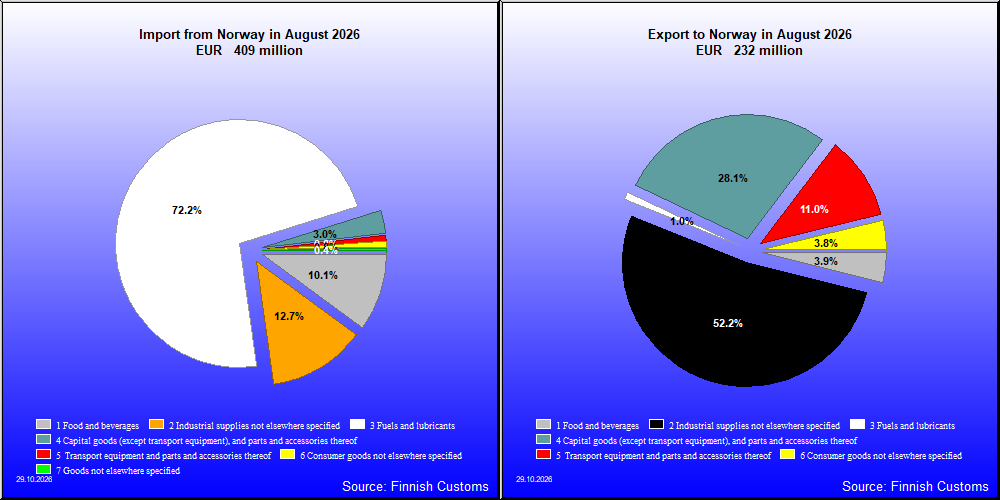

| 8 / 2026 | 8 / 2025 | Change from previous year's equal month % | ||
|---|---|---|---|---|
| 1,000 € | % | 1000 € | ||
| 1. Food and beverages | 9,046 | 3.9 | 4,767 | 89.8 |
| 11. Food and beverages, primary | 586 | 0.3 | 468 | 25.1 |
| 111. Food and beverages, primary, mainly for industry | 236 | 0.1 | 68 | 248.6 |
| 112. Food and beverages, primary, mainly for household consumption | 350 | 0.2 | 401 | -12.7 |
| 12. Food and beverages, processed | 8,460 | 3.6 | 4,299 | 96.8 |
| 121. Food and beverages, processed, mainly for industry | 5,136 | 2.2 | 401 | .. |
| 122. Food and beverages, processed, mainly for household consumption | 3,324 | 1.4 | 3,897 | -14.7 |
| 2. Industrial supplies not elsewhere specified | 121,220 | 52.2 | 104,224 | 16.3 |
| 21. Industrial supplies not elsewhere specified, primary | 6,652 | 2.9 | 11,158 | -40.4 |
| 22. Industrial supplies not elsewhere specified, processed | 114,568 | 49.3 | 93,066 | 23.1 |
| 3. Fuels and lubricants | 2,342 | 1.0 | 966 | 142.4 |
| 31. Fuels and lubricants, primary | 36 | 0.0 | 11 | 241.9 |
| 32. Fuels and lubricants, processed | 2,306 | 1.0 | 956 | 141.3 |
| 322. Fuels and lubricants, other | 2,306 | 1.0 | 956 | 141.3 |
| 4. Capital goods (except transport equipment), and parts and accessories thereof | 65,190 | 28.0 | 50,598 | 28.8 |
| 41. Capital goods (except transport equipment) | 51,330 | 22.1 | 39,822 | 28.9 |
| 42. Capital goods (except transport equipment), parts and accessories | 13,860 | 6.0 | 10,776 | 28.6 |
| 5. Transport equipment and parts and accessories thereof | 25,590 | 11.0 | 24,823 | 3.1 |
| 51. Passenger motor vehicles | 100 | 0.0 | 239 | -58.3 |
| 52. Transport equipment, other than passenger motor vehicles | 12,636 | 5.4 | 11,809 | 7.0 |
| 521. Transport equipment, other than passenger motor vehicles, industrial | 11,684 | 5.0 | 9,509 | 22.9 |
| 522. Transport equipment, other than passenger motor vehicles, non-industrial | 951 | 0.4 | 2,301 | -58.6 |
| 53. Transport equipment, parts and accessories | 12,854 | 5.5 | 12,775 | 0.6 |
| 6. Consumer goods not elsewhere specified | 8,819 | 3.8 | 8,025 | 9.9 |
| 61. Consumer goods not elsewhere specified, durable | 1,885 | 0.8 | 1,655 | 13.9 |
| 62. Consumer goods not elsewhere specified, semi-durable | 4,330 | 1.9 | 3,895 | 11.2 |
| 63. Consumer goods not elsewhere specified, non-durable | 2,604 | 1.1 | 2,476 | 5.2 |
| 7. Goods not elsewhere specified | 201 | 0.1 | 175 | 14.6 |
| All groups | 232,406 | 100.0 | 193,579 | 20.1 |

| 8 / 2026 | 8 / 2025 | Change from previous year's equal month % | ||
|---|---|---|---|---|
| 1,000 € | % | 1,000 € | ||
| 1. Food and beverages | 41,334 | 10.1 | 33,385 | 23.8 |
| 11. Food and beverages, primary | 34,313 | 8.4 | 29,435 | 16.6 |
| 111. Food and beverages, primary, mainly for industry | 46 | 0.0 | 6 | 639.6 |
| 112. Food and beverages, primary, mainly for household consumption | 34,267 | 8.4 | 29,428 | 16.4 |
| 12. Food and beverages, processed | 7,021 | 1.7 | 3,951 | 77.7 |
| 121. Food and beverages, processed, mainly for industry | 388 | 0.1 | 49 | 686.4 |
| 122. Food and beverages, processed, mainly for household consumption | 6,633 | 1.6 | 3,901 | 70.0 |
| 2. Industrial supplies not elsewhere specified | 52,170 | 12.7 | 46,839 | 11.4 |
| 21. Industrial supplies not elsewhere specified, primary | 6,999 | 1.7 | 3,949 | 77.2 |
| 22. Industrial supplies not elsewhere specified, processed | 45,171 | 11.0 | 42,889 | 5.3 |
| 3. Fuels and lubricants | 295,560 | 72.2 | 360,052 | -17.9 |
| 31. Fuels and lubricants, primary | 294,021 | 71.8 | 350,450 | -16.1 |
| 32. Fuels and lubricants, processed | 1,539 | 0.4 | 9,602 | -84.0 |
| 322. Fuels and lubricants, other | 1,539 | 0.4 | 9,602 | -84.0 |
| 4. Capital goods (except transport equipment), and parts and accessories thereof | 12,225 | 3.0 | 18,811 | -35.0 |
| 41. Capital goods (except transport equipment) | 8,024 | 2.0 | 16,399 | -51.1 |
| 42. Capital goods (except transport equipment), parts and accessories | 4,200 | 1.0 | 2,412 | 74.1 |
| 5. Transport equipment and parts and accessories thereof | 3,392 | 0.8 | 2,182 | 55.4 |
| 51. Passenger motor vehicles | 12 | 0.0 | 55 | -78.3 |
| 52. Transport equipment, other than passenger motor vehicles | 3,114 | 0.8 | 1,156 | 169.4 |
| 521. Transport equipment, other than passenger motor vehicles, industrial | 3,081 | 0.8 | 1,095 | 181.5 |
| 522. Transport equipment, other than passenger motor vehicles, non-industrial | 33 | 0.0 | 61 | -45.9 |
| 53. Transport equipment, parts and accessories | 266 | 0.1 | 971 | -72.7 |
| 6. Consumer goods not elsewhere specified | 3,084 | 0.8 | 2,295 | 34.4 |
| 61. Consumer goods not elsewhere specified, durable | 137 | 0.0 | 155 | -11.3 |
| 62. Consumer goods not elsewhere specified, semi-durable | 1,532 | 0.4 | 1,145 | 33.8 |
| 63. Consumer goods not elsewhere specified, non-durable | 1,416 | 0.3 | 995 | 42.3 |
| 7. Goods not elsewhere specified | 1,588 | 0.4 | 59 | .. |
| All groups | 409,353 | 100.0 | 463,623 | -11.7 |
| Classification | Description | Year level | Quarter level | Month level | Year 2026 sofar |
|---|---|---|---|---|---|
| SITC | Standard International Trade Classification (classification system is maintained by the United Nations) | ███ | ███ | ███ | ███ |
| BEC | The standard of statistical classification of BEC (Broad Economic Categories) is upheld by the UN and it is based on SITC-nomenclature. | ███ | ███ | ███ | ███ |
| NACE | National industrial classification based on Statistical Classification of Economic Activities in the European Community Nomenclature générale des Activités économiques dans les Communautés européennes | ███ | ███ | ███ | ███ |
| CPA | CPA = Classification of Products by Activities | ███ | ███ | ███ | ███ |
| CN | The Combined Nomenclature is the common nomenclature of the European Community. | ███ | ███ | ███ | ███ |