
| Export of goods from Finland and import to Finland | Trade Balance |
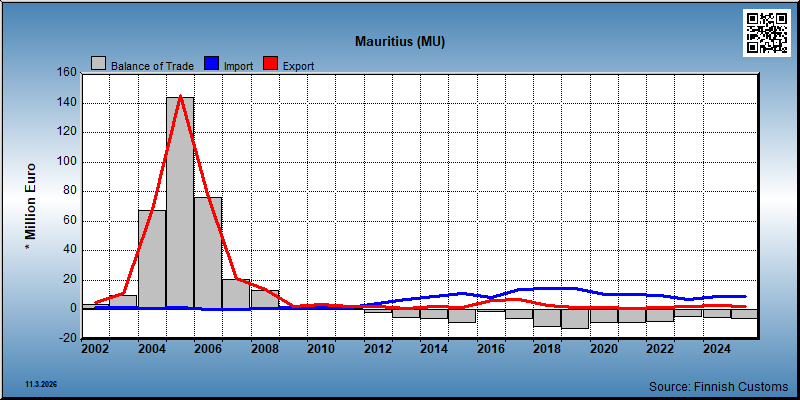
| Year | Import 1,000 € | Export 1,000 € | Trade 1,000 € | Trade balance 1,000 € |
|---|---|---|---|---|
| 2002 | 1,417 | 4,854 | 6,271 | 3,437 |
| 2003 | 1,384 | 11,345 | 12,729 | 9,961 |
| 2004 | 880 | 68,058 | 68,937 | 67,178 |
| 2005 | 1,332 | 144,970 | 146,302 | 143,638 |
| 2006 | 276 | 76,104 | 76,380 | 75,828 |
| 2007 | 551 | 21,341 | 21,892 | 20,790 |
| 2008 | 800 | 13,768 | 14,569 | 12,968 |
| 2009 | 1,668 | 2,490 | 4,158 | 823 |
| 2010 | 1,729 | 3,448 | 5,177 | 1,719 |
| 2011 | 1,925 | 2,628 | 4,553 | 703 |
| 2012 | 4,639 | 2,098 | 6,737 | -2,540 |
| 2013 | 6,821 | 829 | 7,651 | -5,992 |
| 2014 | 8,844 | 2,078 | 10,922 | -6,765 |
| 2015 | 10,981 | 1,845 | 12,826 | -9,136 |
| 2016 | 8,382 | 6,368 | 14,750 | -2,014 |
| 2017 | 13,651 | 7,216 | 20,867 | -6,435 |
| 2018 | 14,366 | 2,710 | 17,076 | -11,656 |
| 2019 | 14,843 | 1,324 | 16,167 | -13,518 |
| 2020 | 10,665 | 1,423 | 12,087 | -9,242 |
| 2021 | 10,254 | 1,041 | 11,295 | -9,213 |
| 2022 | 9,824 | 1,562 | 11,386 | -8,262 |
| 2023 | 7,050 | 2,088 | 9,138 | -4,962 |
| 2024 | 9,037 | 3,080 | 12,118 | -5,957 |
| 2025 | 8,780 | 2,236 | 11,016 | -6,544 |
*) SITC = Standard International Trade Classification (classification system is maintained by the United Nations)
| 2021 | 2022 | 2023 | 2024 | 2025 | ||||||
|---|---|---|---|---|---|---|---|---|---|---|
| 1,000 € | % | 1,000 € | % | 1,000 € | % | 1,000 € | % | 1,000 € | % | |
| 0. Food and live animals | 3 | 0.2 | 3 | 0.2 | 22 | 0.7 | 21 | 0.9 | ||
| 04. Cereals and cereal preparations | 3 | 0.2 | 3 | 0.2 | 22 | 0.7 | 21 | 0.9 | ||
| 1. Beverages and tobacco | 3 | 0.1 | ||||||||
| 11. Beverages | 3 | 0.1 | ||||||||
| 2. Crude materials,inedible,except fuels | 29 | 2.8 | 154 | 9.9 | 16 | 0.5 | 9 | 0.4 | ||
| 24. Cork and wood | 29 | 2.8 | 154 | 9.8 | 16 | 0.5 | 9 | 0.4 | ||
| 5. Chemicals and related products,n.e.s. | 229 | 22.0 | 406 | 26.0 | 461 | 22.1 | 295 | 9.6 | 499 | 22.3 |
| 52. Inorganic chemicals | 1 | 0.1 | 1 | 0.1 | 3 | 0.1 | 1 | 0.0 | 1 | 0.0 |
| 55. Perfume,cleaning etc.preparations | 5 | 0.5 | 8 | 0.5 | 10 | 0.5 | 13 | 0.4 | 13 | 0.6 |
| 57. Plastics in primary forms | 38 | 3.7 | 129 | 8.3 | 60 | 2.9 | 118 | 3.8 | 196 | 8.8 |
| 58. Plastics in non-primary forms | 61 | 5.8 | 161 | 10.3 | 146 | 7.0 | 74 | 2.4 | 149 | 6.7 |
| 59. Chemical materials and products,n.e.s. | 124 | 11.9 | 105 | 6.8 | 242 | 11.6 | 88 | 2.9 | 140 | 6.2 |
| 6. Basic manufactures | 174 | 16.8 | 280 | 18.0 | 179 | 8.6 | 427 | 13.9 | 245 | 11.0 |
| 62. Rubber manufactures,n.e.s. | 3 | 0.2 | 2 | 0.1 | 2 | 0.0 | 1 | 0.1 | ||
| 63. Wood and cork manufactures | 21 | 1.0 | 130 | 4.2 | 26 | 1.2 | ||||
| 64. Paper,paperboard and articles thereof | 86 | 8.3 | 159 | 10.2 | 91 | 4.4 | 172 | 5.6 | 100 | 4.5 |
| 65. Textile yarn,fabrics,made up articles,etc. | 1 | 0.1 | 1 | 0.1 | 2 | 0.1 | 3 | 0.1 | 3 | 0.1 |
| 66. Non-metallic mineral manufactures,n.e.s. | 53 | 5.1 | 80 | 5.1 | 49 | 2.4 | 110 | 3.6 | 45 | 2.0 |
| 67. Iron and steel | 1 | 0.0 | ||||||||
| 69. Manufactures of metals,n.e.s. | 34 | 3.2 | 37 | 2.3 | 13 | 0.6 | 8 | 0.3 | 71 | 3.2 |
| 7. Machinery,transport equipment | 455 | 43.7 | 504 | 32.3 | 1,076 | 51.5 | 1,856 | 60.3 | 1,149 | 51.4 |
| 71. Power generating machinery and equipment | 5 | 0.4 | 19 | 1.2 | 27 | 1.3 | 23 | 0.7 | 2 | 0.1 |
| 72. Machinery for specialized industries | 28 | 2.7 | 45 | 2.9 | 629 | 30.1 | 643 | 20.9 | 156 | 7.0 |
| 74. General industrial machinery n.e.s. | 67 | 6.4 | 50 | 3.2 | 63 | 3.0 | 604 | 19.6 | 24 | 1.1 |
| 75. Office machines and adp machines | 2 | 0.1 | 59 | 1.9 | 7 | 0.3 | ||||
| 76. Telecommunications and sound recording equipment | 11 | 1.0 | 24 | 1.5 | 26 | 1.3 | 37 | 1.2 | 5 | 0.2 |
| 77. Electric machinery,n.e.s.and parts | 341 | 32.8 | 361 | 23.1 | 329 | 15.7 | 489 | 15.9 | 540 | 24.2 |
| 78. Road vehicles | 3 | 0.3 | 3 | 0.2 | 1 | 0.0 | 1 | 0.1 | ||
| 79. Other transport equipment | 1 | 0.0 | 415 | 18.5 | ||||||
| 8. Miscellaneous manufactured articles | 154 | 14.8 | 214 | 13.7 | 370 | 17.7 | 462 | 15.0 | 312 | 14.0 |
| 82. Furniture and parts thereof | 1 | 0.1 | 2 | 0.1 | ||||||
| 84. Articles of apparel and clothing accessories | 1 | 0.1 | 3 | 0.2 | 3 | 0.1 | 5 | 0.2 | 3 | 0.1 |
| 85. Footwear | 1 | 0.0 | 1 | 0.0 | ||||||
| 87. Instruments and apparates n.e.s. | 116 | 11.2 | 144 | 9.2 | 341 | 16.3 | 356 | 11.6 | 274 | 12.2 |
| 88. Photographic equipment,optical goods etc. | 4 | 0.2 | ||||||||
| 89. Miscellaneous manufactured articles,n.e.s. | 36 | 3.4 | 61 | 3.9 | 26 | 1.2 | 100 | 3.2 | 34 | 1.5 |
| All groups combined | 1,041 | 100.0 | 1,562 | 100.0 | 2,090 | 100.0 | 3,080 | 100.0 | 2,236 | 100.0 |
| 2021 | 2022 | 2023 | 2024 | 2025 | ||||||
|---|---|---|---|---|---|---|---|---|---|---|
| 1,000 € | % | 1,000 € | % | 1,000 € | % | 1,000 € | % | 1,000 € | % | |
| 0. Food and live animals | 9,285 | 91.2 | 8,823 | 90.3 | 6,265 | 88.9 | 8,424 | 93.2 | 8,297 | 94.3 |
| 03. Fish and fish preparations | 9,243 | 90.7 | 8,508 | 87.1 | 5,754 | 81.6 | 7,624 | 84.4 | 8,001 | 90.9 |
| 05. Vegetables and fruit | 8 | 0.1 | 4 | 0.0 | ||||||
| 06. Sugars,sugar preparations and honey | 33 | 0.3 | 310 | 3.2 | 511 | 7.3 | 800 | 8.9 | 296 | 3.4 |
| 1. Beverages and tobacco | 1 | 0.0 | 5 | 0.1 | 1 | 0.0 | ||||
| 11. Beverages | 1 | 0.0 | 5 | 0.1 | 1 | 0.0 | ||||
| 5. Chemicals and related products,n.e.s. | 7 | 0.1 | 12 | 0.1 | 7 | 0.1 | 9 | 0.1 | 14 | 0.2 |
| 53. Dyeing,tanning and colouring material | 6 | 0.1 | 10 | 0.1 | 7 | 0.1 | 9 | 0.1 | 12 | 0.1 |
| 54. Medicinal and pharmaceutical products | 1 | 0.0 | 1 | 0.0 | ||||||
| 55. Perfume,cleaning etc.preparations | 1 | 0.0 | ||||||||
| 6. Basic manufactures | 154 | 1.5 | 72 | 0.7 | 48 | 0.7 | 14 | 0.2 | ||
| 65. Textile yarn,fabrics,made up articles,etc. | 154 | 1.5 | 72 | 0.7 | 48 | 0.7 | 14 | 0.2 | ||
| 7. Machinery,transport equipment | 4 | 0.0 | 6 | 0.1 | 51 | 0.7 | 14 | 0.2 | ||
| 77. Electric machinery,n.e.s.and parts | 3 | 0.0 | 6 | 0.1 | 51 | 0.7 | 14 | 0.2 | ||
| 79. Other transport equipment | 1 | 0.0 | ||||||||
| 8. Miscellaneous manufactured articles | 695 | 6.8 | 812 | 8.3 | 677 | 9.6 | 570 | 6.3 | 487 | 5.5 |
| 83. Travel goods,handbags and sim.containers | 9 | 0.1 | 11 | 0.1 | 5 | 0.1 | 8 | 0.1 | 46 | 0.5 |
| 84. Articles of apparel and clothing accessories | 637 | 6.3 | 739 | 7.6 | 555 | 7.9 | 497 | 5.5 | 367 | 4.2 |
| 85. Footwear | 1 | 0.0 | ||||||||
| 87. Instruments and apparates n.e.s. | 2 | 0.0 | 1 | 0.0 | 53 | 0.8 | 2 | 0.0 | ||
| 88. Photographic equipment,optical goods etc. | 2 | 0.0 | 1 | 0.0 | 1 | 0.0 | 9 | 0.1 | ||
| 89. Miscellaneous manufactured articles,n.e.s. | 45 | 0.4 | 58 | 0.6 | 63 | 0.9 | 63 | 0.7 | 65 | 0.7 |
| 9. Goods not classified elsewhere | 52 | 0.5 | 50 | 0.5 | 1 | 0.0 | 1 | 0.0 | ||
| 93. Special transactions and commodities not classified | 52 | 0.5 | 50 | 0.5 | 1 | 0.0 | 1 | 0.0 | ||
| All groups combined | 10,186 | 100.0 | 9,766 | 100.0 | 7,050 | 100.0 | 9,038 | 100.0 | 8,799 | 100.0 |
| Classification | Description | Year level | Quarter level | Month level | |
|---|---|---|---|---|---|
| SITC | Standard International Trade Classification (classification system is maintained by the United Nations) | ||||
| BEC | The standard of statistical classification of BEC (Broad Economic Categories) is upheld by the UN and it is based on SITC-nomenclature. | ||||
| NACE | National industrial classification based on Statistical Classification of Economic Activities in the European Community Nomenclature générale des Activités économiques dans les Communautés européennes | ||||
| CPA | CPA = Classification of Products by Activities | ||||
| CN | The Combined Nomenclature is the common nomenclature of the European Community. |