
| Export of goods from Finland and import to Finland | BEC (Broad Economic Categories) |
*) The standard of statistical classification of BEC (Broad Economic Categories) is upheld by the UN and it is based on SITC-nomenclature.
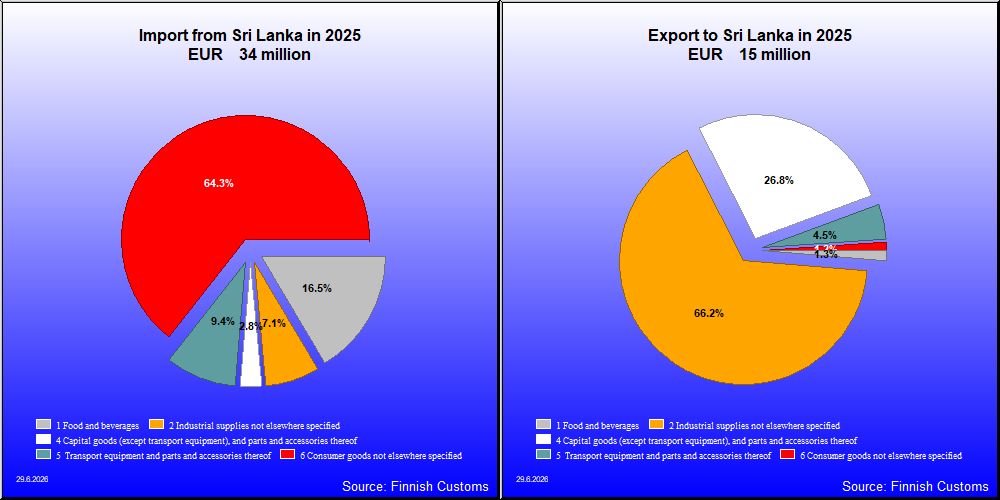
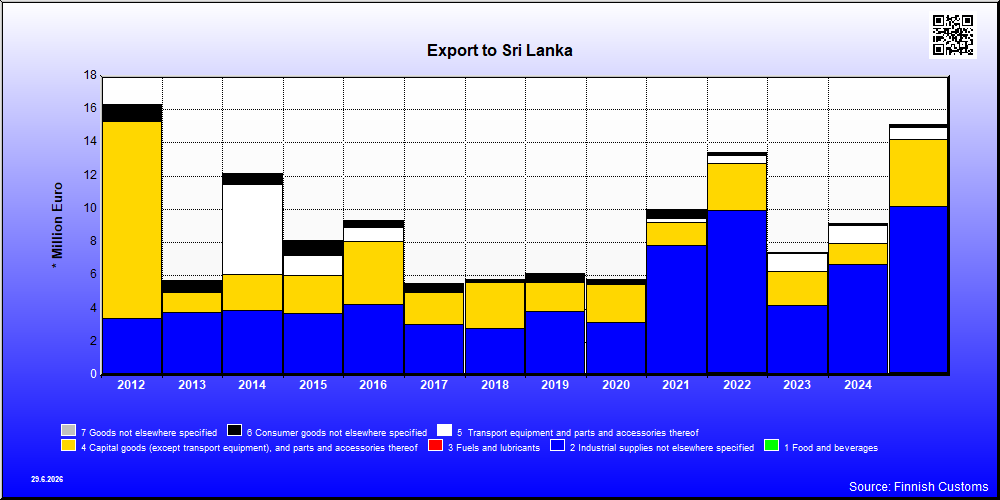
| 2021 | 2022 | 2023 | 2024 | 2025 | ||||||
|---|---|---|---|---|---|---|---|---|---|---|
| 1,000 € | % | 1,000 € | % | 1,000 € | % | 1,000 € | % | 1,000 € | % | |
| 1. Food and beverages | 114 | 1.1 | 156 | 1.2 | 31 | 0.4 | 93 | 1.0 | 192 | 1.3 |
| 11. Food and beverages, primary | 1 | 0.0 | ||||||||
| 111. Food and beverages, primary, mainly for industry | 1 | 0.0 | ||||||||
| 112. Food and beverages, primary, mainly for household consumption | 1 | 0.0 | ||||||||
| 12. Food and beverages, processed | 114 | 1.1 | 156 | 1.2 | 31 | 0.4 | 93 | 1.0 | 191 | 1.3 |
| 121. Food and beverages, processed, mainly for industry | 106 | 1.1 | 156 | 1.2 | 2 | 0.0 | 93 | 1.0 | 187 | 1.2 |
| 122. Food and beverages, processed, mainly for household consumption | 8 | 0.1 | 29 | 0.4 | 4 | 0.0 | ||||
| 2. Industrial supplies not elsewhere specified | 7,734 | 77.2 | 9,776 | 73.0 | 4,209 | 56.7 | 6,587 | 71.9 | 9,995 | 66.2 |
| 21. Industrial supplies not elsewhere specified, primary | 2 | 0.0 | 4 | 0.0 | ||||||
| 22. Industrial supplies not elsewhere specified, processed | 7,734 | 77.2 | 9,776 | 73.0 | 4,207 | 56.7 | 6,583 | 71.9 | 9,995 | 66.2 |
| 4. Capital goods (except transport equipment), and parts and accessories thereof | 1,360 | 13.6 | 2,809 | 21.0 | 2,030 | 27.3 | 1,263 | 13.8 | 4,049 | 26.8 |
| 41. Capital goods (except transport equipment) | 815 | 8.1 | 2,058 | 15.4 | 1,224 | 16.5 | 1,026 | 11.2 | 3,349 | 22.2 |
| 42. Capital goods (except transport equipment), parts and accessories | 544 | 5.4 | 751 | 5.6 | 806 | 10.9 | 237 | 2.6 | 700 | 4.6 |
| 5. Transport equipment and parts and accessories thereof | 271 | 2.7 | 532 | 4.0 | 1,049 | 14.1 | 1,073 | 11.7 | 679 | 4.5 |
| 53. Transport equipment, parts and accessories | 271 | 2.7 | 532 | 4.0 | 1,049 | 14.1 | 1,073 | 11.7 | 679 | 4.5 |
| 6. Consumer goods not elsewhere specified | 534 | 5.3 | 124 | 0.9 | 106 | 1.4 | 145 | 1.6 | 176 | 1.2 |
| 61. Consumer goods not elsewhere specified, durable | 45 | 0.3 | 50 | 0.5 | 7 | 0.0 | ||||
| 62. Consumer goods not elsewhere specified, semi-durable | 66 | 0.7 | 74 | 0.6 | 51 | 0.7 | 53 | 0.6 | 54 | 0.4 |
| 63. Consumer goods not elsewhere specified, non-durable | 468 | 4.7 | 5 | 0.0 | 55 | 0.7 | 42 | 0.5 | 115 | 0.8 |
| All groups | 10,012 | 100.0 | 13,397 | 100.0 | 7,424 | 100.0 | 9,162 | 100.0 | 15,090 | 100.0 |
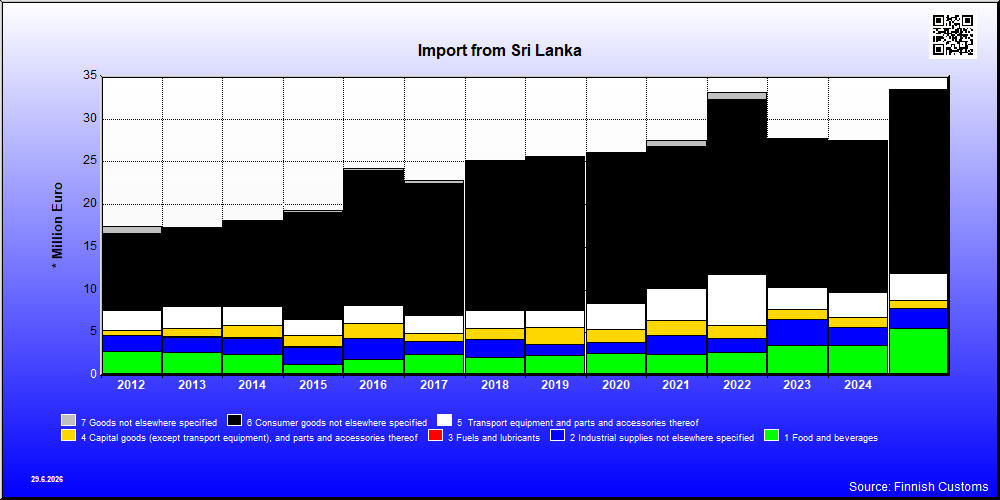
| 2021 | 2022 | 2023 | 2024 | 2025 | ||||||
|---|---|---|---|---|---|---|---|---|---|---|
| 1,000 € | % | 1,000 € | % | 1,000 € | % | 1,000 € | % | 1,000 € | % | |
| 1. Food and beverages | 2,503 | 9.1 | 2,699 | 8.2 | 3,497 | 12.6 | 3,519 | 12.8 | 5,519 | 16.5 |
| 11. Food and beverages, primary | 1,023 | 3.7 | 1,264 | 3.8 | 1,840 | 6.6 | 1,841 | 6.7 | 2,893 | 8.6 |
| 111. Food and beverages, primary, mainly for industry | 13 | 0.0 | 40 | 0.1 | 49 | 0.2 | 30 | 0.1 | 37 | 0.1 |
| 112. Food and beverages, primary, mainly for household consumption | 1,010 | 3.7 | 1,224 | 3.7 | 1,791 | 6.5 | 1,811 | 6.6 | 2,856 | 8.5 |
| 12. Food and beverages, processed | 1,480 | 5.4 | 1,435 | 4.3 | 1,657 | 6.0 | 1,678 | 6.1 | 2,625 | 7.8 |
| 121. Food and beverages, processed, mainly for industry | 367 | 1.3 | 178 | 0.5 | 316 | 1.1 | 319 | 1.2 | 538 | 1.6 |
| 122. Food and beverages, processed, mainly for household consumption | 1,114 | 4.1 | 1,258 | 3.8 | 1,342 | 4.8 | 1,360 | 4.9 | 2,087 | 6.2 |
| 2. Industrial supplies not elsewhere specified | 2,134 | 7.8 | 1,600 | 4.8 | 3,032 | 10.9 | 2,154 | 7.8 | 2,370 | 7.1 |
| 21. Industrial supplies not elsewhere specified, primary | 135 | 0.5 | 95 | 0.3 | 100 | 0.4 | 272 | 1.0 | 467 | 1.4 |
| 22. Industrial supplies not elsewhere specified, processed | 1,999 | 7.3 | 1,504 | 4.5 | 2,932 | 10.6 | 1,882 | 6.9 | 1,902 | 5.7 |
| 3. Fuels and lubricants | 1 | 0.0 | 7 | 0.0 | ||||||
| 31. Fuels and lubricants, primary | 1 | 0.0 | 5 | 0.0 | ||||||
| 32. Fuels and lubricants, processed | 2 | 0.0 | ||||||||
| 322. Fuels and lubricants, other | 2 | 0.0 | ||||||||
| 4. Capital goods (except transport equipment), and parts and accessories thereof | 1,821 | 6.6 | 1,585 | 4.8 | 1,244 | 4.5 | 1,163 | 4.2 | 936 | 2.8 |
| 41. Capital goods (except transport equipment) | 504 | 1.8 | 620 | 1.9 | 303 | 1.1 | 490 | 1.8 | 426 | 1.3 |
| 42. Capital goods (except transport equipment), parts and accessories | 1,316 | 4.8 | 966 | 2.9 | 941 | 3.4 | 672 | 2.4 | 510 | 1.5 |
| 5. Transport equipment and parts and accessories thereof | 3,696 | 13.4 | 5,915 | 17.9 | 2,522 | 9.1 | 2,881 | 10.5 | 3,143 | 9.4 |
| 52. Transport equipment, other than passenger motor vehicles | 1,644 | 6.0 | 3,545 | 10.7 | 866 | 3.1 | 1,306 | 4.8 | 1,790 | 5.3 |
| 521. Transport equipment, other than passenger motor vehicles, industrial | 74 | 0.2 | ||||||||
| 522. Transport equipment, other than passenger motor vehicles, non-industrial | 1,644 | 6.0 | 3,472 | 10.5 | 866 | 3.1 | 1,306 | 4.8 | 1,790 | 5.3 |
| 53. Transport equipment, parts and accessories | 2,052 | 7.5 | 2,370 | 7.2 | 1,656 | 6.0 | 1,575 | 5.7 | 1,353 | 4.0 |
| 6. Consumer goods not elsewhere specified | 16,601 | 60.4 | 20,510 | 62.0 | 17,390 | 62.8 | 17,732 | 64.5 | 21,512 | 64.2 |
| 61. Consumer goods not elsewhere specified, durable | 8 | 0.0 | 2 | 0.0 | 1 | 0.0 | 4 | 0.0 | ||
| 62. Consumer goods not elsewhere specified, semi-durable | 7,413 | 27.0 | 8,808 | 26.6 | 7,863 | 28.4 | 8,056 | 29.3 | 11,647 | 34.8 |
| 63. Consumer goods not elsewhere specified, non-durable | 9,180 | 33.4 | 11,700 | 35.4 | 9,526 | 34.4 | 9,676 | 35.2 | 9,860 | 29.4 |
| 7. Goods not elsewhere specified | 724 | 2.6 | 768 | 2.3 | 17 | 0.1 | 23 | 0.1 | 23 | 0.1 |
| All groups | 27,480 | 100.0 | 33,078 | 100.0 | 27,702 | 100.0 | 27,472 | 100.0 | 33,509 | 100.0 |
| Classification | Description | Year level | Quarter level | Month level | |
|---|---|---|---|---|---|
| SITC | Standard International Trade Classification (classification system is maintained by the United Nations) | ███ | ███ | ███ | |
| BEC | The standard of statistical classification of BEC (Broad Economic Categories) is upheld by the UN and it is based on SITC-nomenclature. | ███ | ███ | ███ | |
| NACE | National industrial classification based on Statistical Classification of Economic Activities in the European Community Nomenclature générale des Activités économiques dans les Communautés européennes | ███ | ███ | ███ | |
| CPA | CPA = Classification of Products by Activities | ███ | ███ | ███ | |
| CN | The Combined Nomenclature is the common nomenclature of the European Community. | ███ | ███ | ███ |