
| Export of goods from Finland and import to Finland | Trade Balance |
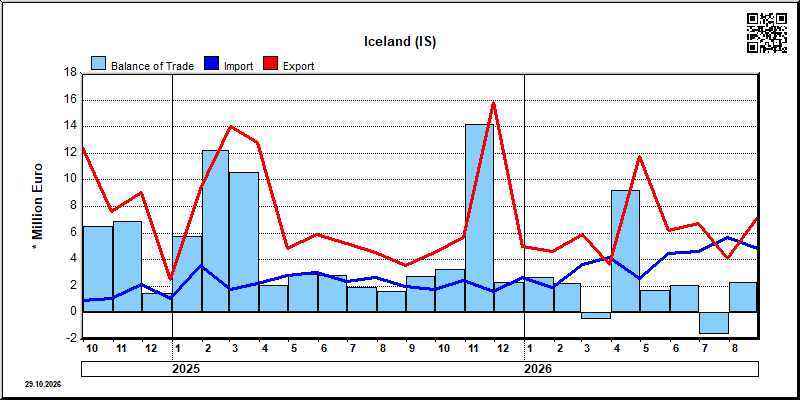
| Year | Month | Import 1,000 € | Export 1,000 € | Trade 1,000 € | Trade Balance 1,000 € |
|---|---|---|---|---|---|
| 2023 | 1 | 2,470 | 5,093 | 7,563 | 2,623 |
| 2023 | 2 | 1,733 | 3,921 | 5,654 | 2,188 |
| 2023 | 3 | 2,566 | 8,053 | 10,619 | 5,488 |
| 2023 | 4 | 2,561 | 6,304 | 8,864 | 3,743 |
| 2023 | 5 | 2,146 | 5,161 | 7,307 | 3,015 |
| 2023 | 6 | 2,181 | 5,861 | 8,042 | 3,681 |
| 2023 | 7 | 1,875 | 5,918 | 7,794 | 4,043 |
| 2023 | 8 | 2,058 | 4,647 | 6,705 | 2,588 |
| 2023 | 9 | 1,476 | 8,019 | 9,495 | 6,543 |
| 2023 | 10 | 1,877 | 6,379 | 8,256 | 4,501 |
| 2023 | 11 | 1,878 | 4,420 | 6,298 | 2,542 |
| 2023 | 12 | 2,864 | 3,370 | 6,235 | 506 |
| 2024 | 1 | 2,864 | 5,843 | 8,707 | 2,979 |
| 2024 | 2 | 2,749 | 4,152 | 6,901 | 1,403 |
| 2024 | 3 | 776 | 4,815 | 5,591 | 4,040 |
| 2024 | 4 | 2,545 | 10,105 | 12,649 | 7,560 |
| 2024 | 5 | 1,558 | 6,514 | 8,072 | 4,957 |
| 2024 | 6 | 1,039 | 14,822 | 15,860 | 13,783 |
| 2024 | 7 | 1,345 | 6,097 | 7,443 | 4,752 |
| 2024 | 8 | 1,040 | 4,902 | 5,942 | 3,861 |
| 2024 | 9 | 919 | 12,443 | 13,362 | 11,524 |
| 2024 | 10 | 1,120 | 7,625 | 8,745 | 6,504 |
| 2024 | 11 | 2,165 | 9,060 | 11,225 | 6,895 |
| 2024 | 12 | 1,064 | 2,530 | 3,594 | 1,466 |
| 2025 | 1 | 3,598 | 9,368 | 12,966 | 5,769 |
| 2025 | 2 | 1,761 | 13,987 | 15,748 | 12,227 |
| 2025 | 3 | 2,244 | 12,803 | 15,048 | 10,559 |
| 2025 | 4 | 2,778 | 4,871 | 7,648 | 2,093 |
| 2025 | 5 | 3,041 | 5,919 | 8,960 | 2,878 |
| 2025 | 6 | 2,353 | 5,202 | 7,556 | 2,849 |
| 2025 | 7 | 2,628 | 4,554 | 7,182 | 1,926 |
| 2025 | 8 | 1,998 | 3,586 | 5,584 | 1,588 |
| 2025 | 9 | 1,775 | 4,524 | 6,299 | 2,749 |
| 2025 | 10 | 2,408 | 5,699 | 8,108 | 3,291 |
| 2025 | 11 | 1,595 | 15,787 | 17,382 | 14,193 |
| 2025 | 12 | 2,698 | 5,002 | 7,700 | 2,304 |
| 2026 | 1 | 1,935 | 4,618 | 6,554 | 2,683 |
| 2026 | 2 | 3,665 | 5,900 | 9,565 | 2,235 |
| 2026 | 3 | 4,182 | 3,658 | 7,841 | -524 |
| 2026 | 4 | 2,564 | 11,766 | 14,331 | 9,202 |
| 2026 | 5 | 4,465 | 6,160 | 10,625 | 1,696 |
| 2026 | 6 | 4,647 | 6,743 | 11,391 | 2,096 |
| 2026 | 7 | 5,670 | 4,076 | 9,746 | -1,594 |
| 2026 | 8 | 4,837 | 7,156 | 11,993 | 2,319 |
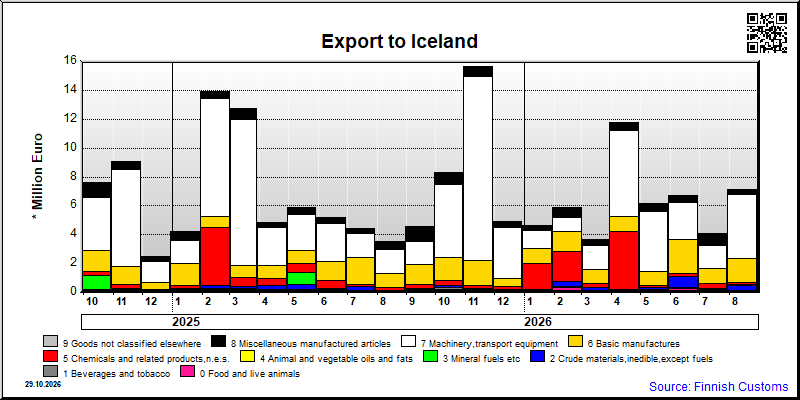
| 2026/4 | 2026/5 | 2026/6 | 2026/7 | 2026/8 | ||||||
|---|---|---|---|---|---|---|---|---|---|---|
| 1000 € | % | 1000 € | % | 1000 € | % | 1000 € | % | 1000 € | % | |
| 0. Food and live animals | 121 | 1.0 | 145 | 2.3 | 285 | 4.2 | 213 | 5.2 | 85 | 1.2 |
| 1. Beverages and tobacco | 34 | 0.3 | 69 | 1.1 | 40 | 0.6 | 46 | 1.1 | 56 | 0.8 |
| 2. Crude materials,inedible,except fuels | 76 | 0.6 | 118 | 1.9 | 777 | 11.5 | 43 | 1.1 | 374 | 5.2 |
| 3. Mineral fuels etc | 11 | 0.1 | 18 | 0.3 | 3 | 0.0 | 1 | 0.0 | 3 | 0.0 |
| 4. Animal and vegetable oils and fats | 1 | 0.0 | 1 | 0.0 | 2 | 0.0 | ||||
| 5. Chemicals and related products,n.e.s. | 3,966 | 33.7 | 131 | 2.1 | 211 | 3.1 | 351 | 8.6 | 204 | 2.9 |
| 6. Basic manufactures | 1,065 | 9.1 | 970 | 15.8 | 2,327 | 34.5 | 976 | 23.9 | 1,630 | 22.8 |
| 7. Machinery,transport equipment | 5,962 | 50.7 | 4,187 | 68.0 | 2,619 | 38.8 | 1,636 | 40.1 | 4,407 | 61.6 |
| 8. Miscellaneous manufactured articles | 531 | 4.5 | 515 | 8.4 | 471 | 7.0 | 811 | 19.9 | 395 | 5.5 |
| 9. Goods not classified elsewhere | 1 | 0.0 | 7 | 0.1 | 8 | 0.1 | 1 | 0.0 | ||
| All groups combined | 11,766 | 100.0 | 6,160 | 100.0 | 6,743 | 100.0 | 4,076 | 100.0 | 7,156 | 100.0 |
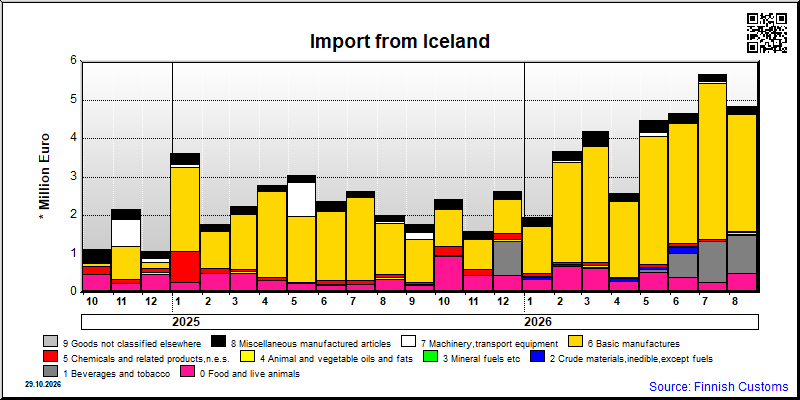
| 2026/4 | 2026/5 | 2026/6 | 2026/7 | 2026/8 | ||||||
|---|---|---|---|---|---|---|---|---|---|---|
| 1000 € | % | 1000 € | % | 1000 € | % | 1000 € | % | 1000 € | % | |
| 0. Food and live animals | 278 | 10.9 | 528 | 11.8 | 385 | 8.3 | 263 | 4.6 | 501 | 10.4 |
| 1. Beverages and tobacco | 82 | 1.8 | 620 | 13.3 | 1,050 | 18.5 | 988 | 20.4 | ||
| 2. Crude materials,inedible,except fuels | 80 | 3.1 | 41 | 0.9 | 154 | 3.3 | 17 | 0.3 | 13 | 0.3 |
| 4. Animal and vegetable oils and fats | 46 | 1.0 | 51 | 1.1 | ||||||
| 5. Chemicals and related products,n.e.s. | 23 | 0.9 | 76 | 1.7 | 55 | 1.2 | 37 | 0.7 | 21 | 0.4 |
| 6. Basic manufactures | 1,970 | 76.8 | 3,330 | 74.6 | 3,121 | 67.1 | 4,050 | 71.4 | 3,050 | 63.0 |
| 7. Machinery,transport equipment | 8 | 0.3 | 89 | 2.0 | 8 | 0.2 | 56 | 1.0 | 33 | 0.7 |
| 8. Miscellaneous manufactured articles | 203 | 7.9 | 318 | 7.1 | 257 | 5.5 | 196 | 3.5 | 179 | 3.7 |
| 9. Goods not classified elsewhere | 2 | 0.1 | 2 | 0.0 | 1 | 0.0 | 1 | 0.0 | 1 | 0.0 |
| All groups combined | 2,564 | 100.0 | 4,465 | 100.0 | 4,647 | 100.0 | 5,670 | 100.0 | 4,837 | 100.0 |
| Classification | Description | Year level | Quarter level | Month level | Year 2026 sofar |
|---|---|---|---|---|---|
| SITC | Standard International Trade Classification (classification system is maintained by the United Nations) | ███ | ███ | ███ | ███ |
| BEC | The standard of statistical classification of BEC (Broad Economic Categories) is upheld by the UN and it is based on SITC-nomenclature. | ███ | ███ | ███ | ███ |
| NACE | National industrial classification based on Statistical Classification of Economic Activities in the European Community Nomenclature générale des Activités économiques dans les Communautés européennes | ███ | ███ | ███ | ███ |
| CPA | CPA = Classification of Products by Activities | ███ | ███ | ███ | ███ |
| CN | The Combined Nomenclature is the common nomenclature of the European Community. | ███ | ███ | ███ | ███ |