
| Export of goods from Finland and import to Finland | BEC (Broad Economic Categories) |
*) The standard of statistical classification of BEC (Broad Economic Categories) is upheld by the UN and it is based on SITC-nomenclature.
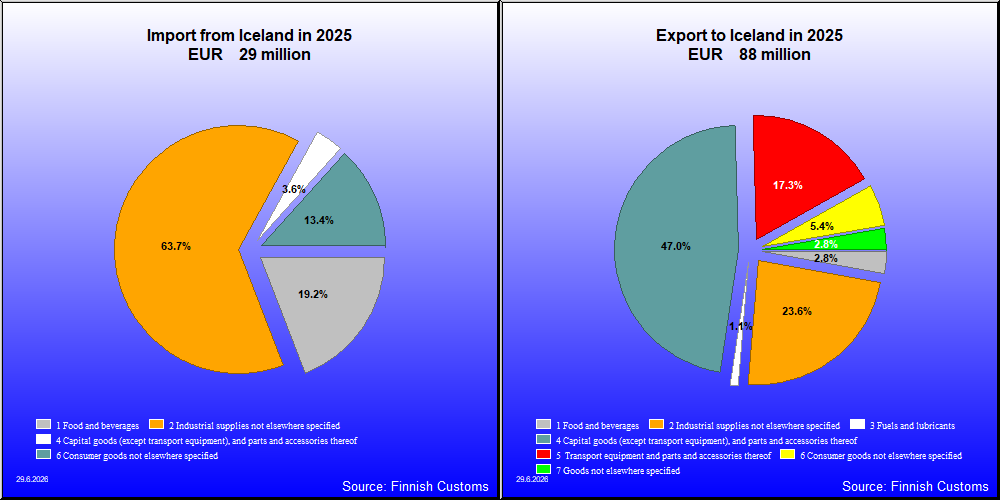
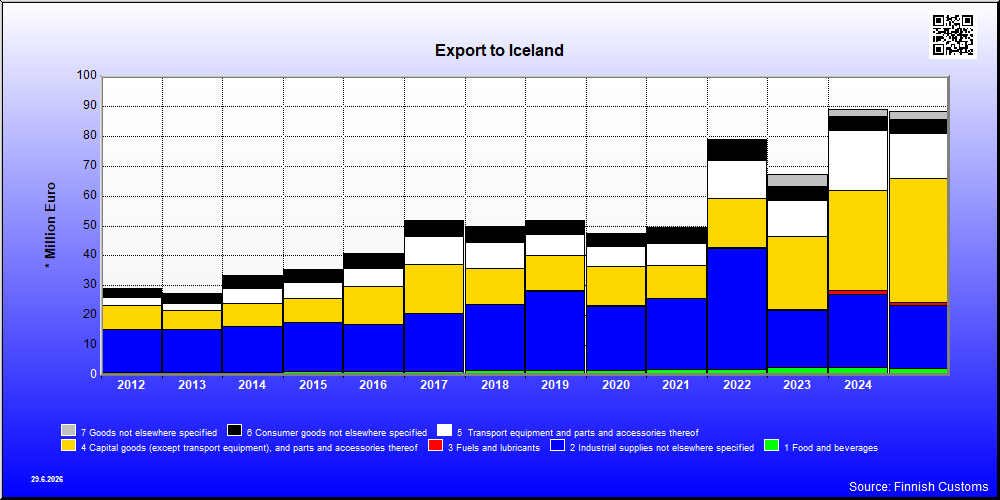
| 2021 | 2022 | 2023 | 2024 | 2025 | ||||||
|---|---|---|---|---|---|---|---|---|---|---|
| 1,000 € | % | 1,000 € | % | 1,000 € | % | 1,000 € | % | 1,000 € | % | |
| 1. Food and beverages | 1,899 | 3.8 | 2,023 | 2.6 | 2,641 | 3.9 | 2,565 | 2.9 | 2,502 | 2.8 |
| 11. Food and beverages, primary | 58 | 0.1 | 22 | 0.0 | 109 | 0.2 | 78 | 0.1 | 97 | 0.1 |
| 111. Food and beverages, primary, mainly for industry | 52 | 0.1 | 17 | 0.0 | 102 | 0.2 | 68 | 0.1 | 92 | 0.1 |
| 112. Food and beverages, primary, mainly for household consumption | 6 | 0.0 | 5 | 0.0 | 7 | 0.0 | 10 | 0.0 | 4 | 0.0 |
| 12. Food and beverages, processed | 1,840 | 3.7 | 2,000 | 2.5 | 2,533 | 3.8 | 2,487 | 2.8 | 2,406 | 2.7 |
| 121. Food and beverages, processed, mainly for industry | 7 | 0.0 | 15 | 0.0 | 167 | 0.2 | 131 | 0.1 | 156 | 0.2 |
| 122. Food and beverages, processed, mainly for household consumption | 1,833 | 3.7 | 1,985 | 2.5 | 2,365 | 3.5 | 2,357 | 2.7 | 2,249 | 2.5 |
| 2. Industrial supplies not elsewhere specified | 23,815 | 48.2 | 40,591 | 51.5 | 19,244 | 28.7 | 24,686 | 27.8 | 20,809 | 23.6 |
| 21. Industrial supplies not elsewhere specified, primary | 89 | 0.2 | 233 | 0.3 | 89 | 0.1 | 180 | 0.2 | 189 | 0.2 |
| 22. Industrial supplies not elsewhere specified, processed | 23,727 | 48.0 | 40,358 | 51.2 | 19,155 | 28.5 | 24,505 | 27.6 | 20,621 | 23.4 |
| 3. Fuels and lubricants | 104 | 0.2 | 107 | 0.1 | 65 | 0.1 | 1,065 | 1.2 | 939 | 1.1 |
| 31. Fuels and lubricants, primary | 76 | 0.2 | 67 | 0.1 | 53 | 0.1 | 60 | 0.1 | 57 | 0.1 |
| 32. Fuels and lubricants, processed | 27 | 0.1 | 41 | 0.1 | 12 | 0.0 | 1,005 | 1.1 | 882 | 1.0 |
| 321. Fuels and lubricants, motor spirit | 24 | 0.0 | ||||||||
| 322. Fuels and lubricants, other | 4 | 0.0 | 41 | 0.1 | 12 | 0.0 | 1,005 | 1.1 | 882 | 1.0 |
| 4. Capital goods (except transport equipment), and parts and accessories thereof | 10,972 | 22.2 | 16,617 | 21.1 | 24,402 | 36.4 | 33,539 | 37.7 | 41,518 | 47.0 |
| 41. Capital goods (except transport equipment) | 7,917 | 16.0 | 12,020 | 15.2 | 19,554 | 29.1 | 28,563 | 32.1 | 36,880 | 41.8 |
| 42. Capital goods (except transport equipment), parts and accessories | 3,055 | 6.2 | 4,597 | 5.8 | 4,848 | 7.2 | 4,976 | 5.6 | 4,637 | 5.3 |
| 5. Transport equipment and parts and accessories thereof | 7,251 | 14.7 | 12,660 | 16.0 | 12,283 | 18.3 | 19,948 | 22.5 | 15,228 | 17.3 |
| 51. Passenger motor vehicles | 23 | 0.0 | 48 | 0.1 | 2,672 | 3.0 | ||||
| 52. Transport equipment, other than passenger motor vehicles | 3,280 | 6.6 | 7,145 | 9.1 | 7,778 | 11.6 | 13,041 | 14.7 | 6,751 | 7.6 |
| 521. Transport equipment, other than passenger motor vehicles, industrial | 2,513 | 5.1 | 5,563 | 7.1 | 6,527 | 9.7 | 12,147 | 13.7 | 5,912 | 6.7 |
| 522. Transport equipment, other than passenger motor vehicles, non-industrial | 767 | 1.6 | 1,582 | 2.0 | 1,250 | 1.9 | 894 | 1.0 | 866 | 1.0 |
| 53. Transport equipment, parts and accessories | 3,948 | 8.0 | 5,467 | 6.9 | 4,506 | 6.7 | 6,907 | 7.8 | 5,805 | 6.6 |
| 6. Consumer goods not elsewhere specified | 5,100 | 10.3 | 6,765 | 8.6 | 4,491 | 6.7 | 4,778 | 5.4 | 4,775 | 5.4 |
| 61. Consumer goods not elsewhere specified, durable | 200 | 0.4 | 339 | 0.4 | 428 | 0.6 | 425 | 0.5 | 420 | 0.5 |
| 62. Consumer goods not elsewhere specified, semi-durable | 3,919 | 7.9 | 5,339 | 6.8 | 2,913 | 4.3 | 3,323 | 3.7 | 3,195 | 3.6 |
| 63. Consumer goods not elsewhere specified, non-durable | 981 | 2.0 | 1,087 | 1.4 | 1,150 | 1.7 | 1,030 | 1.2 | 1,160 | 1.3 |
| 7. Goods not elsewhere specified | 245 | 0.5 | 127 | 0.2 | 3,974 | 5.9 | 2,265 | 2.5 | 2,496 | 2.8 |
| All groups | 49,386 | 100.0 | 78,889 | 100.0 | 67,099 | 100.0 | 88,847 | 100.0 | 88,267 | 100.0 |
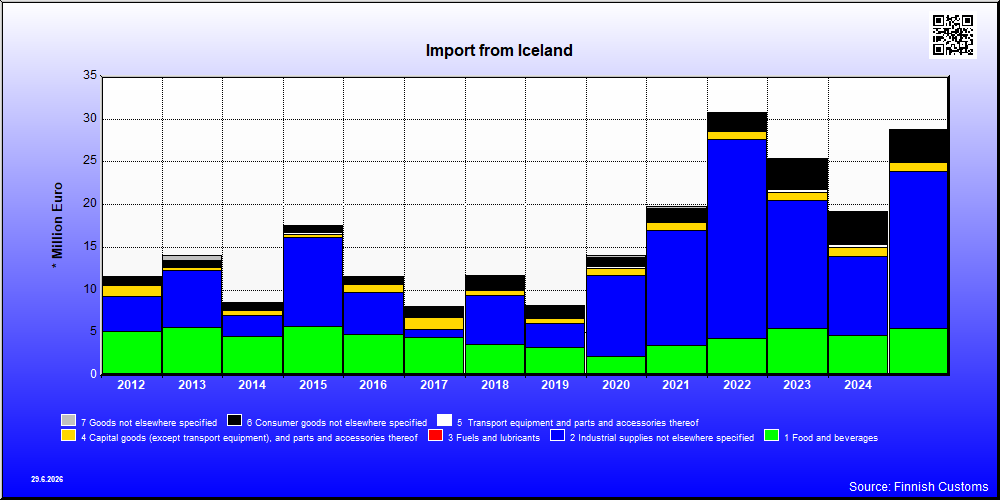
| 2021 | 2022 | 2023 | 2024 | 2025 | ||||||
|---|---|---|---|---|---|---|---|---|---|---|
| 1,000 € | % | 1,000 € | % | 1,000 € | % | 1,000 € | % | 1,000 € | % | |
| 1. Food and beverages | 3,457 | 17.5 | 4,277 | 13.9 | 5,540 | 21.8 | 4,715 | 24.6 | 5,519 | 19.2 |
| 11. Food and beverages, primary | 1,572 | 8.0 | 1,944 | 6.3 | 1,316 | 5.2 | 963 | 5.0 | 1,372 | 4.8 |
| 111. Food and beverages, primary, mainly for industry | 257 | 1.3 | 135 | 0.4 | 15 | 0.1 | ||||
| 112. Food and beverages, primary, mainly for household consumption | 1,315 | 6.7 | 1,809 | 5.9 | 1,301 | 5.1 | 963 | 5.0 | 1,372 | 4.8 |
| 12. Food and beverages, processed | 1,885 | 9.6 | 2,332 | 7.6 | 4,225 | 16.6 | 3,752 | 19.6 | 4,147 | 14.4 |
| 121. Food and beverages, processed, mainly for industry | 53 | 0.3 | 145 | 0.5 | 104 | 0.5 | 95 | 0.3 | ||
| 122. Food and beverages, processed, mainly for household consumption | 1,832 | 9.3 | 2,188 | 7.1 | 4,224 | 16.6 | 3,648 | 19.0 | 4,051 | 14.1 |
| 2. Industrial supplies not elsewhere specified | 13,560 | 68.7 | 23,394 | 75.9 | 14,936 | 58.7 | 9,181 | 47.9 | 18,344 | 63.7 |
| 21. Industrial supplies not elsewhere specified, primary | 80 | 0.4 | 117 | 0.4 | 234 | 0.9 | 192 | 1.0 | 93 | 0.3 |
| 22. Industrial supplies not elsewhere specified, processed | 13,480 | 68.3 | 23,276 | 75.5 | 14,702 | 57.8 | 8,990 | 46.9 | 18,251 | 63.3 |
| 4. Capital goods (except transport equipment), and parts and accessories thereof | 879 | 4.5 | 889 | 2.9 | 956 | 3.8 | 1,141 | 5.9 | 1,044 | 3.6 |
| 41. Capital goods (except transport equipment) | 766 | 3.9 | 648 | 2.1 | 565 | 2.2 | 517 | 2.7 | 472 | 1.6 |
| 42. Capital goods (except transport equipment), parts and accessories | 113 | 0.6 | 241 | 0.8 | 390 | 1.5 | 624 | 3.3 | 572 | 2.0 |
| 5. Transport equipment and parts and accessories thereof | 181 | 0.9 | 6 | 0.0 | 339 | 1.3 | 238 | 1.2 | 19 | 0.1 |
| 51. Passenger motor vehicles | 176 | 0.9 | 51 | 0.3 | 8 | 0.0 | ||||
| 52. Transport equipment, other than passenger motor vehicles | 337 | 1.3 | 169 | 0.9 | ||||||
| 521. Transport equipment, other than passenger motor vehicles, industrial | 337 | 1.3 | 169 | 0.9 | ||||||
| 53. Transport equipment, parts and accessories | 5 | 0.0 | 6 | 0.0 | 2 | 0.0 | 18 | 0.1 | 10 | 0.0 |
| 6. Consumer goods not elsewhere specified | 1,523 | 7.7 | 2,159 | 7.0 | 3,637 | 14.3 | 3,881 | 20.2 | 3,868 | 13.4 |
| 61. Consumer goods not elsewhere specified, durable | 385 | 2.0 | 1,168 | 3.8 | 1,324 | 5.2 | 1,683 | 8.8 | 1,426 | 4.9 |
| 62. Consumer goods not elsewhere specified, semi-durable | 784 | 4.0 | 60 | 0.2 | 42 | 0.2 | 107 | 0.6 | 48 | 0.2 |
| 63. Consumer goods not elsewhere specified, non-durable | 354 | 1.8 | 932 | 3.0 | 2,271 | 8.9 | 2,092 | 10.9 | 2,395 | 8.3 |
| 7. Goods not elsewhere specified | 126 | 0.6 | 95 | 0.3 | 40 | 0.2 | 27 | 0.1 | 21 | 0.1 |
| All groups | 19,726 | 100.0 | 30,819 | 100.0 | 25,448 | 100.0 | 19,185 | 100.0 | 28,814 | 100.0 |
| Classification | Description | Year level | Quarter level | Month level | |
|---|---|---|---|---|---|
| SITC | Standard International Trade Classification (classification system is maintained by the United Nations) | ███ | ███ | ███ | |
| BEC | The standard of statistical classification of BEC (Broad Economic Categories) is upheld by the UN and it is based on SITC-nomenclature. | ███ | ███ | ███ | |
| NACE | National industrial classification based on Statistical Classification of Economic Activities in the European Community Nomenclature générale des Activités économiques dans les Communautés européennes | ███ | ███ | ███ | |
| CPA | CPA = Classification of Products by Activities | ███ | ███ | ███ | |
| CN | The Combined Nomenclature is the common nomenclature of the European Community. | ███ | ███ | ███ |