
| Export of goods from Finland and import to Finland | BEC (Broad Economic Categories) |
*) The standard of statistical classification of BEC (Broad Economic Categories) is upheld by the UN and it is based on SITC-nomenclature.
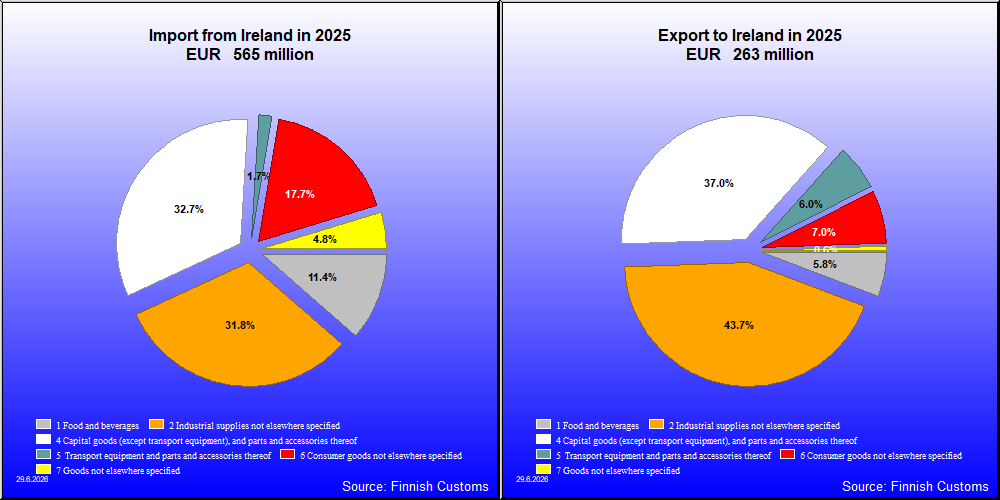
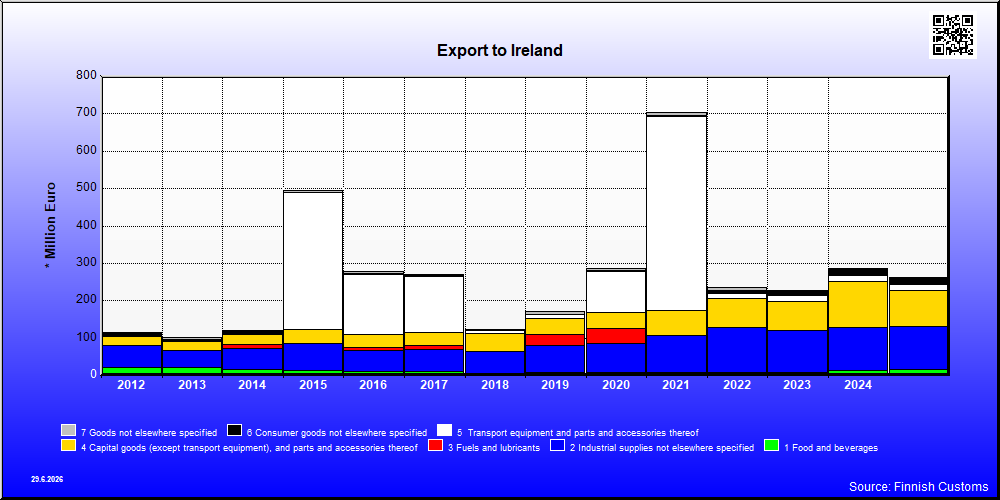
| 2021 | 2022 | 2023 | 2024 | 2025 | ||||||
|---|---|---|---|---|---|---|---|---|---|---|
| 1,000 € | % | 1,000 € | % | 1,000 € | % | 1,000 € | % | 1,000 € | % | |
| 1. Food and beverages | 7,711 | 1.1 | 8,123 | 3.5 | 7,271 | 3.2 | 12,394 | 4.3 | 15,156 | 5.8 |
| 11. Food and beverages, primary | 1,828 | 0.3 | 483 | 0.2 | 2 | 0.0 | 812 | 0.3 | 435 | 0.2 |
| 111. Food and beverages, primary, mainly for industry | 1,612 | 0.2 | ||||||||
| 112. Food and beverages, primary, mainly for household consumption | 216 | 0.0 | 483 | 0.2 | 2 | 0.0 | 812 | 0.3 | 435 | 0.2 |
| 12. Food and beverages, processed | 5,883 | 0.8 | 7,641 | 3.3 | 7,268 | 3.2 | 11,582 | 4.0 | 14,721 | 5.6 |
| 121. Food and beverages, processed, mainly for industry | 4,092 | 0.6 | 5,110 | 2.2 | 1,999 | 0.9 | 2,047 | 0.7 | 7,248 | 2.8 |
| 122. Food and beverages, processed, mainly for household consumption | 1,791 | 0.3 | 2,531 | 1.1 | 5,269 | 2.3 | 9,535 | 3.3 | 7,473 | 2.8 |
| 2. Industrial supplies not elsewhere specified | 99,767 | 14.2 | 121,547 | 52.3 | 112,692 | 49.3 | 115,167 | 40.2 | 114,935 | 43.7 |
| 21. Industrial supplies not elsewhere specified, primary | 2,990 | 0.4 | 3,863 | 1.7 | 8,310 | 3.6 | 11,204 | 3.9 | 10,799 | 4.1 |
| 22. Industrial supplies not elsewhere specified, processed | 96,777 | 13.8 | 117,685 | 50.7 | 104,382 | 45.7 | 103,963 | 36.3 | 104,136 | 39.6 |
| 3. Fuels and lubricants | 10 | 0.0 | 24 | 0.0 | 11 | 0.0 | 10 | 0.0 | 30 | 0.0 |
| 32. Fuels and lubricants, processed | 10 | 0.0 | 24 | 0.0 | 11 | 0.0 | 10 | 0.0 | 30 | 0.0 |
| 321. Fuels and lubricants, motor spirit | 10 | 0.0 | 2 | 0.0 | 1 | 0.0 | ||||
| 322. Fuels and lubricants, other | 22 | 0.0 | 10 | 0.0 | 10 | 0.0 | 30 | 0.0 | ||
| 4. Capital goods (except transport equipment), and parts and accessories thereof | 65,247 | 9.3 | 75,202 | 32.4 | 78,272 | 34.2 | 122,959 | 43.0 | 97,291 | 37.0 |
| 41. Capital goods (except transport equipment) | 47,099 | 6.7 | 61,028 | 26.3 | 56,557 | 24.7 | 96,411 | 33.7 | 68,539 | 26.1 |
| 42. Capital goods (except transport equipment), parts and accessories | 18,148 | 2.6 | 14,175 | 6.1 | 21,715 | 9.5 | 26,548 | 9.3 | 28,751 | 10.9 |
| 5. Transport equipment and parts and accessories thereof | 519,889 | 73.9 | 15,515 | 6.7 | 17,015 | 7.4 | 17,115 | 6.0 | 15,706 | 6.0 |
| 51. Passenger motor vehicles | 4 | 0.0 | 361 | 0.1 | 1,366 | 0.5 | ||||
| 52. Transport equipment, other than passenger motor vehicles | 516,657 | 73.5 | 8,607 | 3.7 | 7,958 | 3.5 | 12,920 | 4.5 | 12,034 | 4.6 |
| 521. Transport equipment, other than passenger motor vehicles, industrial | 516,657 | 73.5 | 8,607 | 3.7 | 7,958 | 3.5 | 11,328 | 4.0 | 12,026 | 4.6 |
| 522. Transport equipment, other than passenger motor vehicles, non-industrial | 1,592 | 0.6 | 9 | 0.0 | ||||||
| 53. Transport equipment, parts and accessories | 3,232 | 0.5 | 6,903 | 3.0 | 9,057 | 4.0 | 3,884 | 1.4 | 2,305 | 0.9 |
| 6. Consumer goods not elsewhere specified | 2,774 | 0.4 | 6,078 | 2.6 | 12,199 | 5.3 | 16,501 | 5.8 | 18,306 | 7.0 |
| 61. Consumer goods not elsewhere specified, durable | 759 | 0.1 | 1,069 | 0.5 | 1,088 | 0.5 | 688 | 0.2 | 693 | 0.3 |
| 62. Consumer goods not elsewhere specified, semi-durable | 1,312 | 0.2 | 2,018 | 0.9 | 2,038 | 0.9 | 2,195 | 0.8 | 2,909 | 1.1 |
| 63. Consumer goods not elsewhere specified, non-durable | 703 | 0.1 | 2,991 | 1.3 | 9,073 | 4.0 | 13,618 | 4.8 | 14,704 | 5.6 |
| 7. Goods not elsewhere specified | 7,649 | 1.1 | 7,750 | 3.3 | 1,175 | 0.5 | 2,017 | 0.7 | 1,514 | 0.6 |
| All groups | 703,047 | 100.0 | 232,186 | 100.0 | 228,636 | 100.0 | 286,164 | 100.0 | 262,938 | 100.0 |
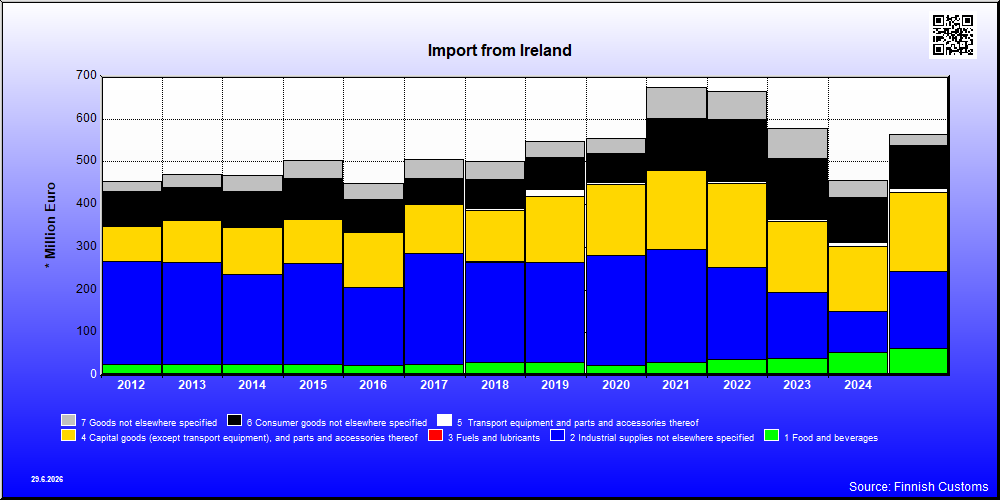
| 2021 | 2022 | 2023 | 2024 | 2025 | ||||||
|---|---|---|---|---|---|---|---|---|---|---|
| 1,000 € | % | 1,000 € | % | 1,000 € | % | 1,000 € | % | 1,000 € | % | |
| 1. Food and beverages | 30,035 | 4.5 | 37,329 | 5.8 | 38,709 | 6.7 | 53,576 | 11.7 | 64,354 | 11.4 |
| 11. Food and beverages, primary | 127 | 0.0 | 56 | 0.0 | 60 | 0.0 | 61 | 0.0 | 37 | 0.0 |
| 111. Food and beverages, primary, mainly for industry | 11 | 0.0 | 9 | 0.0 | ||||||
| 112. Food and beverages, primary, mainly for household consumption | 115 | 0.0 | 47 | 0.0 | 60 | 0.0 | 61 | 0.0 | 37 | 0.0 |
| 12. Food and beverages, processed | 29,909 | 4.4 | 37,272 | 5.7 | 38,649 | 6.7 | 53,515 | 11.7 | 64,318 | 11.4 |
| 121. Food and beverages, processed, mainly for industry | 1,266 | 0.2 | 153 | 0.0 | 223 | 0.0 | 10 | 0.0 | 72 | 0.0 |
| 122. Food and beverages, processed, mainly for household consumption | 28,643 | 4.3 | 37,119 | 5.7 | 38,426 | 6.7 | 53,505 | 11.7 | 64,246 | 11.4 |
| 2. Industrial supplies not elsewhere specified | 264,683 | 39.3 | 215,340 | 33.2 | 156,068 | 27.0 | 97,399 | 21.3 | 179,705 | 31.8 |
| 21. Industrial supplies not elsewhere specified, primary | 133,063 | 19.8 | 127,299 | 19.6 | 59,149 | 10.2 | 391 | 0.1 | 75,861 | 13.4 |
| 22. Industrial supplies not elsewhere specified, processed | 131,621 | 19.5 | 88,041 | 13.6 | 96,919 | 16.8 | 97,008 | 21.2 | 103,844 | 18.4 |
| 3. Fuels and lubricants | 9 | 0.0 | 34 | 0.0 | 9 | 0.0 | 13 | 0.0 | 23 | 0.0 |
| 31. Fuels and lubricants, primary | 2 | 0.0 | 4 | 0.0 | 5 | 0.0 | 4 | 0.0 | ||
| 32. Fuels and lubricants, processed | 9 | 0.0 | 33 | 0.0 | 5 | 0.0 | 8 | 0.0 | 20 | 0.0 |
| 321. Fuels and lubricants, motor spirit | 1 | 0.0 | ||||||||
| 322. Fuels and lubricants, other | 9 | 0.0 | 33 | 0.0 | 5 | 0.0 | 7 | 0.0 | 20 | 0.0 |
| 4. Capital goods (except transport equipment), and parts and accessories thereof | 184,259 | 27.4 | 197,894 | 30.5 | 166,674 | 28.9 | 150,861 | 33.0 | 184,710 | 32.7 |
| 41. Capital goods (except transport equipment) | 169,287 | 25.1 | 188,158 | 29.0 | 156,476 | 27.1 | 142,526 | 31.2 | 174,674 | 30.9 |
| 42. Capital goods (except transport equipment), parts and accessories | 14,972 | 2.2 | 9,736 | 1.5 | 10,198 | 1.8 | 8,335 | 1.8 | 10,036 | 1.8 |
| 5. Transport equipment and parts and accessories thereof | 3,675 | 0.5 | 2,885 | 0.4 | 4,888 | 0.8 | 9,439 | 2.1 | 9,363 | 1.7 |
| 51. Passenger motor vehicles | 16 | 0.0 | ||||||||
| 52. Transport equipment, other than passenger motor vehicles | 164 | 0.0 | 243 | 0.0 | 55 | 0.0 | 54 | 0.0 | 147 | 0.0 |
| 521. Transport equipment, other than passenger motor vehicles, industrial | 164 | 0.0 | 243 | 0.0 | 41 | 0.0 | 54 | 0.0 | 95 | 0.0 |
| 522. Transport equipment, other than passenger motor vehicles, non-industrial | 14 | 0.0 | 52 | 0.0 | ||||||
| 53. Transport equipment, parts and accessories | 3,494 | 0.5 | 2,642 | 0.4 | 4,833 | 0.8 | 9,386 | 2.1 | 9,216 | 1.6 |
| 6. Consumer goods not elsewhere specified | 118,327 | 17.6 | 145,312 | 22.4 | 141,152 | 24.5 | 104,867 | 22.9 | 99,853 | 17.7 |
| 61. Consumer goods not elsewhere specified, durable | 9,136 | 1.4 | 10,808 | 1.7 | 10,692 | 1.9 | 14,917 | 3.3 | 17,443 | 3.1 |
| 62. Consumer goods not elsewhere specified, semi-durable | 5,090 | 0.8 | 7,188 | 1.1 | 6,204 | 1.1 | 8,245 | 1.8 | 7,782 | 1.4 |
| 63. Consumer goods not elsewhere specified, non-durable | 104,101 | 15.5 | 127,315 | 19.6 | 124,256 | 21.5 | 81,705 | 17.9 | 74,628 | 13.2 |
| 7. Goods not elsewhere specified | 72,318 | 10.7 | 66,425 | 10.2 | 69,715 | 12.1 | 41,252 | 9.0 | 27,328 | 4.8 |
| All groups | 673,305 | 100.0 | 648,274 | 100.0 | 577,215 | 100.0 | 457,407 | 100.0 | 565,337 | 100.0 |
| Classification | Description | Year level | Quarter level | Month level | |
|---|---|---|---|---|---|
| SITC | Standard International Trade Classification (classification system is maintained by the United Nations) | ███ | ███ | ███ | |
| BEC | The standard of statistical classification of BEC (Broad Economic Categories) is upheld by the UN and it is based on SITC-nomenclature. | ███ | ███ | ███ | |
| NACE | National industrial classification based on Statistical Classification of Economic Activities in the European Community Nomenclature générale des Activités économiques dans les Communautés européennes | ███ | ███ | ███ | |
| CPA | CPA = Classification of Products by Activities | ███ | ███ | ███ | |
| CN | The Combined Nomenclature is the common nomenclature of the European Community. | ███ | ███ | ███ |