
| Export of goods from Finland and import to Finland | BEC (Broad Economic Categories) |
*) The standard of statistical classification of BEC (Broad Economic Categories) is upheld by the UN and it is based on SITC-nomenclature.

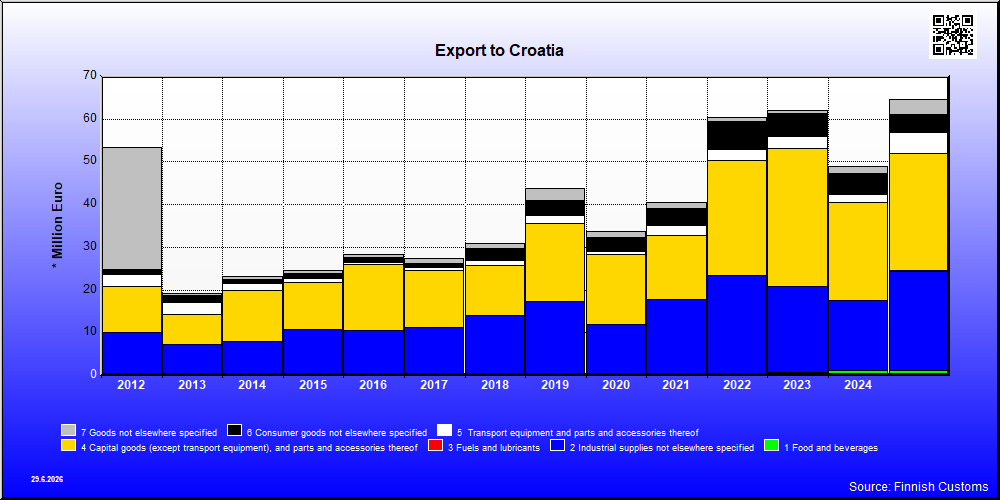
| 2021 | 2022 | 2023 | 2024 | 2025 | ||||||
|---|---|---|---|---|---|---|---|---|---|---|
| 1,000 € | % | 1,000 € | % | 1,000 € | % | 1,000 € | % | 1,000 € | % | |
| 1. Food and beverages | 228 | 0.6 | 530 | 0.9 | 619 | 1.0 | 1,198 | 2.5 | 1,146 | 1.8 |
| 12. Food and beverages, processed | 228 | 0.6 | 530 | 0.9 | 619 | 1.0 | 1,198 | 2.5 | 1,146 | 1.8 |
| 121. Food and beverages, processed, mainly for industry | 29 | 0.1 | 51 | 0.1 | 61 | 0.1 | 69 | 0.1 | 125 | 0.2 |
| 122. Food and beverages, processed, mainly for household consumption | 199 | 0.5 | 479 | 0.8 | 558 | 0.9 | 1,129 | 2.3 | 1,021 | 1.6 |
| 2. Industrial supplies not elsewhere specified | 17,527 | 43.2 | 22,845 | 37.8 | 20,131 | 32.4 | 16,411 | 33.6 | 23,316 | 36.1 |
| 21. Industrial supplies not elsewhere specified, primary | 1,082 | 2.7 | 519 | 0.9 | 474 | 0.8 | 235 | 0.5 | 75 | 0.1 |
| 22. Industrial supplies not elsewhere specified, processed | 16,445 | 40.5 | 22,326 | 37.0 | 19,656 | 31.7 | 16,176 | 33.1 | 23,242 | 36.0 |
| 3. Fuels and lubricants | 2 | 0.0 | 9 | 0.0 | 5 | 0.0 | 14 | 0.0 | ||
| 32. Fuels and lubricants, processed | 2 | 0.0 | 9 | 0.0 | 5 | 0.0 | 14 | 0.0 | ||
| 322. Fuels and lubricants, other | 2 | 0.0 | 9 | 0.0 | 5 | 0.0 | 14 | 0.0 | ||
| 4. Capital goods (except transport equipment), and parts and accessories thereof | 15,004 | 37.0 | 26,849 | 44.5 | 32,483 | 52.4 | 22,814 | 46.7 | 27,395 | 42.4 |
| 41. Capital goods (except transport equipment) | 11,041 | 27.2 | 20,943 | 34.7 | 24,479 | 39.5 | 15,361 | 31.4 | 21,523 | 33.3 |
| 42. Capital goods (except transport equipment), parts and accessories | 3,963 | 9.8 | 5,906 | 9.8 | 8,005 | 12.9 | 7,453 | 15.3 | 5,872 | 9.1 |
| 5. Transport equipment and parts and accessories thereof | 2,243 | 5.5 | 2,707 | 4.5 | 2,747 | 4.4 | 2,017 | 4.1 | 5,102 | 7.9 |
| 52. Transport equipment, other than passenger motor vehicles | 1,090 | 2.7 | 1,856 | 3.1 | 2,401 | 3.9 | 1,210 | 2.5 | 4,764 | 7.4 |
| 521. Transport equipment, other than passenger motor vehicles, industrial | 1,090 | 2.7 | 1,477 | 2.4 | 1,106 | 1.8 | 503 | 1.0 | 427 | 0.7 |
| 522. Transport equipment, other than passenger motor vehicles, non-industrial | 379 | 0.6 | 1,295 | 2.1 | 706 | 1.4 | 4,336 | 6.7 | ||
| 53. Transport equipment, parts and accessories | 1,153 | 2.8 | 851 | 1.4 | 346 | 0.6 | 807 | 1.7 | 338 | 0.5 |
| 6. Consumer goods not elsewhere specified | 4,177 | 10.3 | 6,431 | 10.7 | 5,456 | 8.8 | 4,917 | 10.1 | 4,206 | 6.5 |
| 61. Consumer goods not elsewhere specified, durable | 123 | 0.3 | 275 | 0.5 | 221 | 0.4 | 349 | 0.7 | 551 | 0.9 |
| 62. Consumer goods not elsewhere specified, semi-durable | 1,416 | 3.5 | 3,783 | 6.3 | 3,189 | 5.1 | 2,813 | 5.8 | 1,876 | 2.9 |
| 63. Consumer goods not elsewhere specified, non-durable | 2,638 | 6.5 | 2,373 | 3.9 | 2,046 | 3.3 | 1,756 | 3.6 | 1,779 | 2.8 |
| 7. Goods not elsewhere specified | 1,427 | 3.5 | 1,141 | 1.9 | 598 | 1.0 | 1,508 | 3.1 | 3,393 | 5.3 |
| All groups | 40,605 | 100.0 | 60,373 | 100.0 | 62,043 | 100.0 | 48,871 | 100.0 | 64,573 | 100.0 |
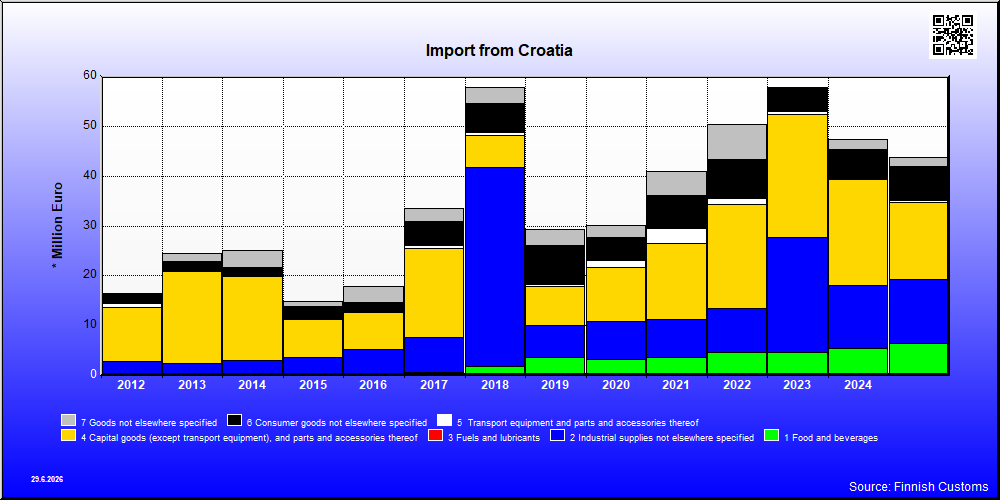
| 2021 | 2022 | 2023 | 2024 | 2025 | ||||||
|---|---|---|---|---|---|---|---|---|---|---|
| 1,000 € | % | 1,000 € | % | 1,000 € | % | 1,000 € | % | 1,000 € | % | |
| 1. Food and beverages | 3,560 | 8.7 | 4,643 | 9.3 | 4,692 | 8.1 | 5,514 | 11.7 | 6,409 | 14.7 |
| 11. Food and beverages, primary | 286 | 0.7 | 24 | 0.0 | 57 | 0.1 | 33 | 0.1 | 67 | 0.2 |
| 112. Food and beverages, primary, mainly for household consumption | 286 | 0.7 | 24 | 0.0 | 57 | 0.1 | 33 | 0.1 | 67 | 0.2 |
| 12. Food and beverages, processed | 3,274 | 8.0 | 4,619 | 9.2 | 4,635 | 8.0 | 5,482 | 11.6 | 6,342 | 14.5 |
| 121. Food and beverages, processed, mainly for industry | 123 | 0.3 | 141 | 0.3 | 154 | 0.3 | 111 | 0.2 | 132 | 0.3 |
| 122. Food and beverages, processed, mainly for household consumption | 3,152 | 7.7 | 4,478 | 9.0 | 4,481 | 7.8 | 5,371 | 11.4 | 6,210 | 14.2 |
| 2. Industrial supplies not elsewhere specified | 7,741 | 18.9 | 8,822 | 17.7 | 23,075 | 39.9 | 12,515 | 26.5 | 12,843 | 29.4 |
| 21. Industrial supplies not elsewhere specified, primary | 10,266 | 17.8 | ||||||||
| 22. Industrial supplies not elsewhere specified, processed | 7,741 | 18.9 | 8,822 | 17.7 | 12,809 | 22.2 | 12,515 | 26.5 | 12,843 | 29.4 |
| 3. Fuels and lubricants | 1 | 0.0 | 1 | 0.0 | 20 | 0.0 | 14 | 0.0 | ||
| 32. Fuels and lubricants, processed | 1 | 0.0 | 1 | 0.0 | 20 | 0.0 | 14 | 0.0 | ||
| 321. Fuels and lubricants, motor spirit | 1 | 0.0 | ||||||||
| 322. Fuels and lubricants, other | 1 | 0.0 | 20 | 0.0 | 14 | 0.0 | ||||
| 4. Capital goods (except transport equipment), and parts and accessories thereof | 15,240 | 37.2 | 20,868 | 41.8 | 24,676 | 42.7 | 21,190 | 44.8 | 15,510 | 35.5 |
| 41. Capital goods (except transport equipment) | 9,476 | 23.1 | 17,399 | 34.8 | 15,351 | 26.6 | 20,189 | 42.7 | 13,767 | 31.5 |
| 42. Capital goods (except transport equipment), parts and accessories | 5,764 | 14.1 | 3,468 | 6.9 | 9,325 | 16.1 | 1,002 | 2.1 | 1,743 | 4.0 |
| 5. Transport equipment and parts and accessories thereof | 2,892 | 7.1 | 1,101 | 2.2 | 489 | 0.8 | 253 | 0.5 | 356 | 0.8 |
| 52. Transport equipment, other than passenger motor vehicles | 18 | 0.0 | 23 | 0.0 | 152 | 0.3 | 38 | 0.1 | 127 | 0.3 |
| 521. Transport equipment, other than passenger motor vehicles, industrial | 18 | 0.0 | 23 | 0.0 | 152 | 0.3 | 37 | 0.1 | 2 | 0.0 |
| 522. Transport equipment, other than passenger motor vehicles, non-industrial | 1 | 0.0 | 125 | 0.3 | ||||||
| 53. Transport equipment, parts and accessories | 2,874 | 7.0 | 1,078 | 2.2 | 337 | 0.6 | 215 | 0.5 | 229 | 0.5 |
| 6. Consumer goods not elsewhere specified | 6,617 | 16.2 | 7,862 | 15.7 | 4,603 | 8.0 | 5,941 | 12.6 | 6,839 | 15.6 |
| 61. Consumer goods not elsewhere specified, durable | 1,203 | 2.9 | 657 | 1.3 | 143 | 0.2 | 193 | 0.4 | 291 | 0.7 |
| 62. Consumer goods not elsewhere specified, semi-durable | 2,516 | 6.1 | 2,421 | 4.8 | 2,780 | 4.8 | 3,237 | 6.8 | 4,071 | 9.3 |
| 63. Consumer goods not elsewhere specified, non-durable | 2,899 | 7.1 | 4,784 | 9.6 | 1,679 | 2.9 | 2,512 | 5.3 | 2,477 | 5.7 |
| 7. Goods not elsewhere specified | 4,889 | 11.9 | 7,103 | 14.2 | 234 | 0.4 | 1,866 | 3.9 | 1,772 | 4.1 |
| All groups | 40,942 | 100.0 | 49,939 | 100.0 | 57,770 | 100.0 | 47,299 | 100.0 | 43,743 | 100.0 |
| Classification | Description | Year level | Quarter level | Month level | |
|---|---|---|---|---|---|
| SITC | Standard International Trade Classification (classification system is maintained by the United Nations) | ███ | ███ | ███ | |
| BEC | The standard of statistical classification of BEC (Broad Economic Categories) is upheld by the UN and it is based on SITC-nomenclature. | ███ | ███ | ███ | |
| NACE | National industrial classification based on Statistical Classification of Economic Activities in the European Community Nomenclature générale des Activités économiques dans les Communautés européennes | ███ | ███ | ███ | |
| CPA | CPA = Classification of Products by Activities | ███ | ███ | ███ | |
| CN | The Combined Nomenclature is the common nomenclature of the European Community. | ███ | ███ | ███ |