
| Export of goods from Finland and import to Finland | Trade Balance |
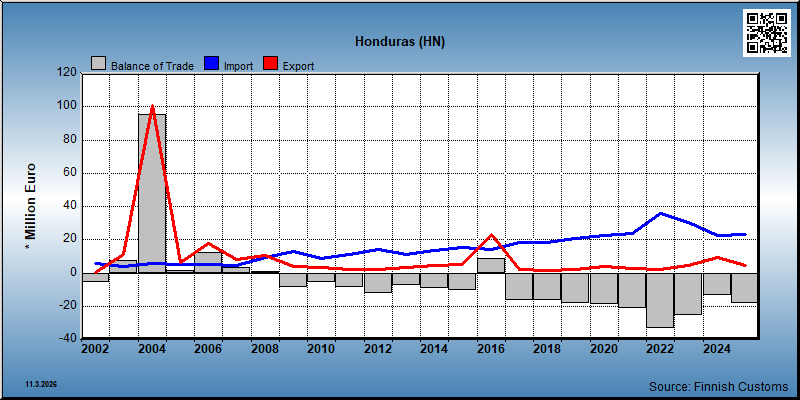
| Year | Import 1,000 € | Export 1,000 € | Trade 1,000 € | Trade balance 1,000 € |
|---|---|---|---|---|
| 2002 | 5,743 | 296 | 6,039 | -5,448 |
| 2003 | 3,768 | 11,027 | 14,795 | 7,258 |
| 2004 | 5,687 | 100,823 | 106,510 | 95,136 |
| 2005 | 4,979 | 6,360 | 11,339 | 1,381 |
| 2006 | 5,256 | 17,773 | 23,029 | 12,517 |
| 2007 | 4,641 | 8,218 | 12,858 | 3,577 |
| 2008 | 9,614 | 10,234 | 19,849 | 620 |
| 2009 | 12,811 | 3,968 | 16,779 | -8,844 |
| 2010 | 8,618 | 3,079 | 11,696 | -5,539 |
| 2011 | 10,990 | 1,993 | 12,982 | -8,997 |
| 2012 | 14,136 | 1,976 | 16,112 | -12,161 |
| 2013 | 10,918 | 3,218 | 14,136 | -7,700 |
| 2014 | 13,742 | 4,397 | 18,139 | -9,344 |
| 2015 | 15,531 | 4,845 | 20,376 | -10,685 |
| 2016 | 14,081 | 22,947 | 37,028 | 8,866 |
| 2017 | 18,594 | 2,060 | 20,654 | -16,535 |
| 2018 | 18,180 | 1,350 | 19,529 | -16,830 |
| 2019 | 20,558 | 2,090 | 22,648 | -18,468 |
| 2020 | 22,558 | 3,758 | 26,316 | -18,800 |
| 2021 | 24,037 | 2,550 | 26,587 | -21,487 |
| 2022 | 35,628 | 2,359 | 37,987 | -33,269 |
| 2023 | 30,467 | 4,787 | 35,254 | -25,679 |
| 2024 | 22,592 | 9,210 | 31,802 | -13,382 |
| 2025 | 23,320 | 4,705 | 28,026 | -18,615 |
*) SITC = Standard International Trade Classification (classification system is maintained by the United Nations)


| 2021 | 2022 | 2023 | 2024 | 2025 | ||||||
|---|---|---|---|---|---|---|---|---|---|---|
| 1,000 € | % | 1,000 € | % | 1,000 € | % | 1,000 € | % | 1,000 € | % | |
| 3. Mineral fuels etc | 1 | 0.0 | 3 | 0.1 | 5 | 0.1 | 2 | 0.0 | ||
| 33. Petroleum and products | 1 | 0.0 | 3 | 0.1 | 5 | 0.1 | 2 | 0.0 | ||
| 5. Chemicals and related products,n.e.s. | 14 | 0.5 | 18 | 0.8 | 247 | 5.2 | 193 | 2.1 | 63 | 1.3 |
| 54. Medicinal and pharmaceutical products | 163 | 3.4 | 90 | 1.0 | 38 | 0.8 | ||||
| 58. Plastics in non-primary forms | 8 | 0.3 | 18 | 0.8 | 84 | 1.8 | 102 | 1.1 | 13 | 0.3 |
| 59. Chemical materials and products,n.e.s. | 5 | 0.2 | 12 | 0.3 | ||||||
| 6. Basic manufactures | 1,139 | 44.7 | 1,185 | 50.2 | 472 | 9.9 | 899 | 9.8 | 2,950 | 62.7 |
| 62. Rubber manufactures,n.e.s. | 18 | 0.7 | 13 | 0.5 | 67 | 1.4 | 3 | 0.0 | 14 | 0.3 |
| 63. Wood and cork manufactures | 2 | 0.1 | ||||||||
| 64. Paper,paperboard and articles thereof | 1,077 | 42.3 | 1,124 | 47.7 | 348 | 7.3 | 855 | 9.3 | 2,800 | 59.5 |
| 65. Textile yarn,fabrics,made up articles,etc. | 20 | 0.8 | 3 | 0.1 | 29 | 0.6 | ||||
| 66. Non-metallic mineral manufactures,n.e.s. | 2 | 0.0 | ||||||||
| 67. Iron and steel | 21 | 0.8 | 25 | 1.0 | 8 | 0.2 | 1 | 0.0 | ||
| 68. Non-ferrous metals | 1 | 0.0 | ||||||||
| 69. Manufactures of metals,n.e.s. | 2 | 0.1 | 17 | 0.7 | 17 | 0.4 | 39 | 0.4 | 135 | 2.9 |
| 7. Machinery,transport equipment | 1,017 | 39.9 | 1,001 | 42.4 | 3,822 | 79.8 | 7,937 | 86.2 | 1,031 | 21.9 |
| 71. Power generating machinery and equipment | 281 | 11.0 | 234 | 9.9 | 2,635 | 55.0 | 5,528 | 60.0 | 243 | 5.2 |
| 72. Machinery for specialized industries | 16 | 0.6 | 15 | 0.7 | 16 | 0.3 | 353 | 3.8 | 38 | 0.8 |
| 74. General industrial machinery n.e.s. | 111 | 4.4 | 320 | 13.6 | 359 | 7.5 | 750 | 8.1 | 291 | 6.2 |
| 75. Office machines and adp machines | 37 | 0.4 | ||||||||
| 76. Telecommunications and sound recording equipment | 8 | 0.3 | 11 | 0.2 | 4 | 0.0 | 12 | 0.3 | ||
| 77. Electric machinery,n.e.s.and parts | 599 | 23.5 | 431 | 18.3 | 801 | 16.7 | 1,266 | 13.7 | 447 | 9.5 |
| 8. Miscellaneous manufactured articles | 283 | 11.1 | 155 | 6.6 | 243 | 5.1 | 176 | 1.9 | 660 | 14.0 |
| 81. Prefabr.buildings;sanitary,lighting etc.fixtrs | 1 | 0.1 | ||||||||
| 82. Furniture and parts thereof | 2 | 0.0 | ||||||||
| 83. Travel goods,handbags and sim.containers | 2 | 0.1 | ||||||||
| 87. Instruments and apparates n.e.s. | 160 | 6.3 | 91 | 3.8 | 125 | 2.6 | 164 | 1.8 | 637 | 13.5 |
| 89. Miscellaneous manufactured articles,n.e.s. | 120 | 4.7 | 64 | 2.7 | 119 | 2.5 | 10 | 0.1 | 22 | 0.5 |
| 9. Goods not classified elsewhere | 98 | 3.8 | ||||||||
| 96. Coin (not gold coin or legal) | 98 | 3.8 | ||||||||
| All groups combined | 2,550 | 100.0 | 2,359 | 100.0 | 4,787 | 100.0 | 9,210 | 100.0 | 4,705 | 100.0 |
| 2021 | 2022 | 2023 | 2024 | 2025 | ||||||
|---|---|---|---|---|---|---|---|---|---|---|
| 1,000 € | % | 1,000 € | % | 1,000 € | % | 1,000 € | % | 1,000 € | % | |
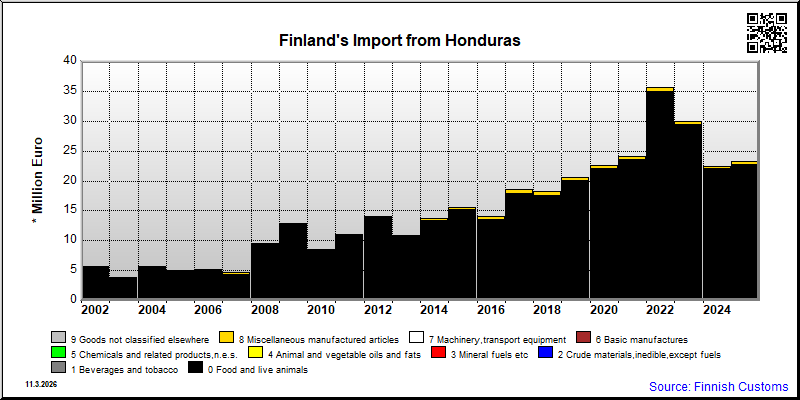
| 0. Food and live animals | 23,497 | 97.8 | 34,925 | 98.0 | 29,485 | 98.2 | 22,001 | 97.7 | 22,749 | 97.6 |
| 05. Vegetables and fruit | 161 | 0.7 | 310 | 0.9 | 58 | 0.2 | 205 | 0.9 | 289 | 1.2 |
| 07. Coffee,tea,cocoa,spices | 23,336 | 97.1 | 34,615 | 97.2 | 29,425 | 98.0 | 21,796 | 96.8 | 22,460 | 96.3 |
| 08. Feeding stuff for animals | 1 | 0.0 | ||||||||
| 2. Crude materials,inedible,except fuels | 3 | 0.0 | 1 | 0.0 | 1 | 0.0 | ||||
| 24. Cork and wood | 1 | 0.0 | 1 | 0.0 | 1 | 0.0 | ||||
| 29. Crude animal,vegetable materials n.e.s. | 2 | 0.0 | ||||||||
| 5. Chemicals and related products,n.e.s. | 16 | 0.1 | 9 | 0.0 | 1 | 0.0 | ||||
| 54. Medicinal and pharmaceutical products | 5 | 0.0 | ||||||||
| 55. Perfume,cleaning etc.preparations | 16 | 0.1 | ||||||||
| 58. Plastics in non-primary forms | 4 | 0.0 | ||||||||
| 6. Basic manufactures | 1 | 0.0 | 14 | 0.0 | 29 | 0.1 | 33 | 0.1 | 5 | 0.0 |
| 63. Wood and cork manufactures | 1 | 0.0 | 1 | 0.0 | ||||||
| 64. Paper,paperboard and articles thereof | 12 | 0.0 | 26 | 0.1 | 32 | 0.1 | 3 | 0.0 | ||
| 65. Textile yarn,fabrics,made up articles,etc. | 2 | 0.0 | 1 | 0.0 | ||||||
| 7. Machinery,transport equipment | 4 | 0.0 | 26 | 0.1 | 6 | 0.0 | 16 | 0.1 | 11 | 0.0 |
| 71. Power generating machinery and equipment | 1 | 0.0 | ||||||||
| 74. General industrial machinery n.e.s. | 1 | 0.0 | ||||||||
| 77. Electric machinery,n.e.s.and parts | 4 | 0.0 | 25 | 0.1 | 4 | 0.0 | 12 | 0.1 | 9 | 0.0 |
| 78. Road vehicles | 1 | 0.0 | 2 | 0.0 | 2 | 0.0 | 1 | 0.0 | ||
| 8. Miscellaneous manufactured articles | 498 | 2.1 | 637 | 1.8 | 499 | 1.7 | 458 | 2.0 | 542 | 2.3 |
| 82. Furniture and parts thereof | 3 | 0.0 | ||||||||
| 84. Articles of apparel and clothing accessories | 498 | 2.1 | 633 | 1.8 | 499 | 1.7 | 457 | 2.0 | 539 | 2.3 |
| 87. Instruments and apparates n.e.s. | 1 | 0.0 | ||||||||
| 89. Miscellaneous manufactured articles,n.e.s. | 1 | 0.0 | 1 | 0.0 | 2 | 0.0 | ||||
| 9. Goods not classified elsewhere | 20 | 0.1 | 27 | 0.1 | 1 | 0.0 | 2 | 0.0 | 3 | 0.0 |
| 93. Special transactions and commodities not classified | 20 | 0.1 | 27 | 0.1 | 1 | 0.0 | 2 | 0.0 | 3 | 0.0 |
| All groups combined | 24,037 | 100.0 | 35,625 | 100.0 | 30,030 | 100.0 | 22,510 | 100.0 | 23,311 | 100.0 |
| Classification | Description | Year level | Quarter level | Month level | |
|---|---|---|---|---|---|
| SITC | Standard International Trade Classification (classification system is maintained by the United Nations) | ███ | |||
| BEC | The standard of statistical classification of BEC (Broad Economic Categories) is upheld by the UN and it is based on SITC-nomenclature. | ███ | |||
| NACE | National industrial classification based on Statistical Classification of Economic Activities in the European Community Nomenclature générale des Activités économiques dans les Communautés européennes | ███ | |||
| CPA | CPA = Classification of Products by Activities | ███ | |||
| CN | The Combined Nomenclature is the common nomenclature of the European Community. | ███ |