
| Export of goods from Finland and import to Finland | Trade Balance |

| Year | Month | Import 1,000 € | Export 1,000 € | Trade 1,000 € | Trade Balance 1,000 € |
|---|---|---|---|---|---|
| 2023 | 1 | 124 | 2,521 | 2,645 | 2,397 |
| 2023 | 2 | 217 | 2,081 | 2,298 | 1,864 |
| 2023 | 3 | 414 | 3,132 | 3,546 | 2,718 |
| 2023 | 4 | 233 | 2,044 | 2,277 | 1,812 |
| 2023 | 5 | 399 | 2,623 | 3,021 | 2,224 |
| 2023 | 6 | 191 | 2,993 | 3,184 | 2,801 |
| 2023 | 7 | 217 | 2,608 | 2,825 | 2,391 |
| 2023 | 8 | 305 | 2,381 | 2,686 | 2,077 |
| 2023 | 9 | 116 | 2,311 | 2,427 | 2,195 |
| 2023 | 10 | 572 | 2,315 | 2,887 | 1,743 |
| 2023 | 11 | 158 | 1,524 | 1,682 | 1,366 |
| 2023 | 12 | 174 | 2,761 | 2,936 | 2,587 |
| 2024 | 1 | 247 | 2,778 | 3,025 | 2,531 |
| 2024 | 2 | 280 | 1,192 | 1,472 | 913 |
| 2024 | 3 | 239 | 1,642 | 1,881 | 1,403 |
| 2024 | 4 | 133 | 2,765 | 2,898 | 2,632 |
| 2024 | 5 | 1,240 | 2,266 | 3,506 | 1,027 |
| 2024 | 6 | 675 | 1,575 | 2,250 | 899 |
| 2024 | 7 | 579 | 1,955 | 2,534 | 1,376 |
| 2024 | 8 | 194 | 1,886 | 2,080 | 1,692 |
| 2024 | 9 | 292 | 2,446 | 2,738 | 2,154 |
| 2024 | 10 | 256 | 1,707 | 1,963 | 1,452 |
| 2024 | 11 | 315 | 2,927 | 3,242 | 2,612 |
| 2024 | 12 | 133 | 2,724 | 2,857 | 2,591 |
| 2025 | 1 | 494 | 1,722 | 2,216 | 1,229 |
| 2025 | 2 | 229 | 1,990 | 2,219 | 1,762 |
| 2025 | 3 | 408 | 2,615 | 3,023 | 2,207 |
| 2025 | 4 | 464 | 1,871 | 2,335 | 1,408 |
| 2025 | 5 | 283 | 3,761 | 4,045 | 3,478 |
| 2025 | 6 | 165 | 3,282 | 3,447 | 3,117 |
| 2025 | 7 | 227 | 3,539 | 3,766 | 3,312 |
| 2025 | 8 | 341 | 2,890 | 3,231 | 2,548 |
| 2025 | 9 | 262 | 3,977 | 4,239 | 3,716 |
| 2025 | 10 | 199 | 2,252 | 2,452 | 2,053 |
| 2025 | 11 | 241 | 2,016 | 2,257 | 1,776 |
| 2025 | 12 | 236 | 3,492 | 3,727 | 3,256 |
| 2026 | 1 | 533 | 1,188 | 1,721 | 654 |
| 2026 | 2 | 279 | 1,491 | 1,770 | 1,212 |
| 2026 | 3 | 158 | 2,436 | 2,594 | 2,278 |
| 2026 | 4 | 275 | 2,234 | 2,510 | 1,959 |
| 2026 | 5 | 402 | 1,543 | 1,945 | 1,141 |
| 2026 | 6 | 252 | 1,795 | 2,047 | 1,543 |
| 2026 | 7 | 187 | 2,144 | 2,331 | 1,956 |
| 2026 | 8 | 354 | 2,212 | 2,566 | 1,858 |
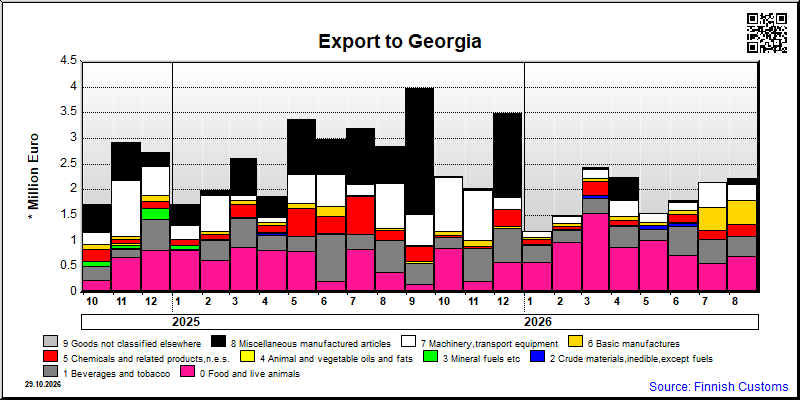
| 2026/4 | 2026/5 | 2026/6 | 2026/7 | 2026/8 | ||||||
|---|---|---|---|---|---|---|---|---|---|---|
| 1000 € | % | 1000 € | % | 1000 € | % | 1000 € | % | 1000 € | % | |
| 0. Food and live animals | 871 | 39.0 | 1,008 | 65.3 | 718 | 40.0 | 573 | 26.7 | 703 | 31.8 |
| 1. Beverages and tobacco | 413 | 18.5 | 227 | 14.7 | 567 | 31.6 | 465 | 21.7 | 383 | 17.3 |
| 2. Crude materials,inedible,except fuels | 66 | 4.3 | 60 | 3.4 | ||||||
| 3. Mineral fuels etc | 5 | 0.3 | ||||||||
| 4. Animal and vegetable oils and fats | 23 | 1.0 | 22 | 1.2 | ||||||
| 5. Chemicals and related products,n.e.s. | 99 | 4.4 | 13 | 0.8 | 152 | 8.5 | 172 | 8.0 | 235 | 10.6 |
| 6. Basic manufactures | 82 | 3.6 | 40 | 2.6 | 70 | 3.9 | 450 | 21.0 | 463 | 20.9 |
| 7. Machinery,transport equipment | 313 | 14.0 | 179 | 11.6 | 150 | 8.4 | 473 | 22.1 | 326 | 14.7 |
| 8. Miscellaneous manufactured articles | 433 | 19.4 | 10 | 0.7 | 51 | 2.8 | 9 | 0.4 | 102 | 4.6 |
| All groups combined | 2,234 | 100.0 | 1,543 | 100.0 | 1,795 | 100.0 | 2,144 | 100.0 | 2,212 | 100.0 |

| 2026/4 | 2026/5 | 2026/6 | 2026/7 | 2026/8 | ||||||
|---|---|---|---|---|---|---|---|---|---|---|
| 1000 € | % | 1000 € | % | 1000 € | % | 1000 € | % | 1000 € | % | |
| 0. Food and live animals | 121 | 43.9 | 174 | 43.2 | 98 | 39.0 | 87 | 46.6 | 123 | 34.6 |
| 1. Beverages and tobacco | 65 | 23.4 | 125 | 31.0 | 102 | 40.5 | 72 | 38.2 | 60 | 17.0 |
| 2. Crude materials,inedible,except fuels | 80 | 19.9 | 1 | 0.5 | 125 | 35.3 | ||||
| 5. Chemicals and related products,n.e.s. | 12 | 4.3 | 1 | 0.3 | 4 | 1.6 | 4 | 2.0 | 16 | 4.4 |
| 6. Basic manufactures | 45 | 16.5 | 1 | 0.6 | 4 | 2.4 | 4 | 1.1 | ||
| 7. Machinery,transport equipment | 4 | 1.3 | 2 | 0.4 | 1 | 0.8 | ||||
| 8. Miscellaneous manufactured articles | 29 | 10.4 | 21 | 5.2 | 44 | 17.5 | 19 | 9.9 | 26 | 7.4 |
| 9. Goods not classified elsewhere | ||||||||||
| All groups combined | 275 | 100.0 | 402 | 100.0 | 252 | 100.0 | 187 | 100.0 | 354 | 100.0 |
| Classification | Description | Year level | Quarter level | Month level | Year 2026 sofar |
|---|---|---|---|---|---|
| SITC | Standard International Trade Classification (classification system is maintained by the United Nations) | ███ | ███ | ███ | ███ |
| BEC | The standard of statistical classification of BEC (Broad Economic Categories) is upheld by the UN and it is based on SITC-nomenclature. | ███ | ███ | ███ | ███ |
| NACE | National industrial classification based on Statistical Classification of Economic Activities in the European Community Nomenclature générale des Activités économiques dans les Communautés européennes | ███ | ███ | ███ | ███ |
| CPA | CPA = Classification of Products by Activities | ███ | ███ | ███ | ███ |
| CN | The Combined Nomenclature is the common nomenclature of the European Community. | ███ | ███ | ███ | ███ |