
| Export of goods from Finland and import to Finland | BEC (Broad Economic Categories) |
*) The standard of statistical classification of BEC (Broad Economic Categories) is upheld by the UN and it is based on SITC-nomenclature.
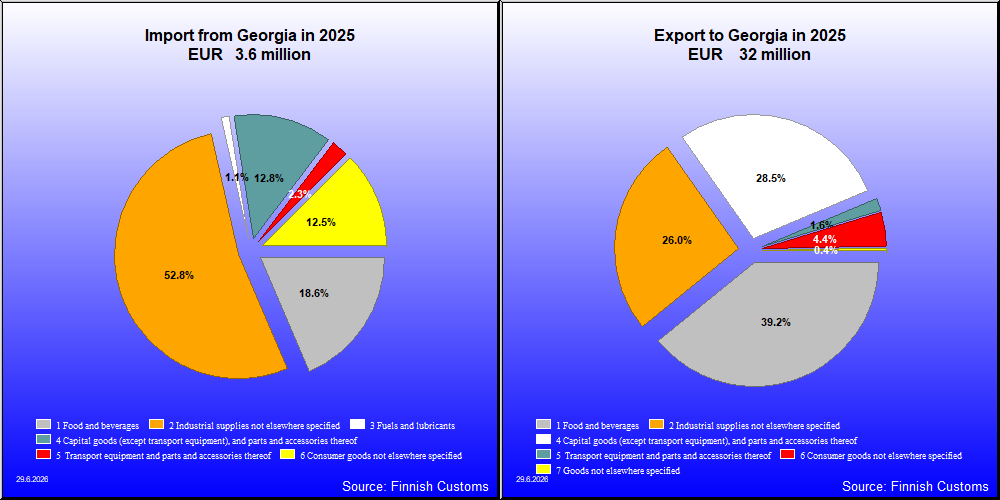
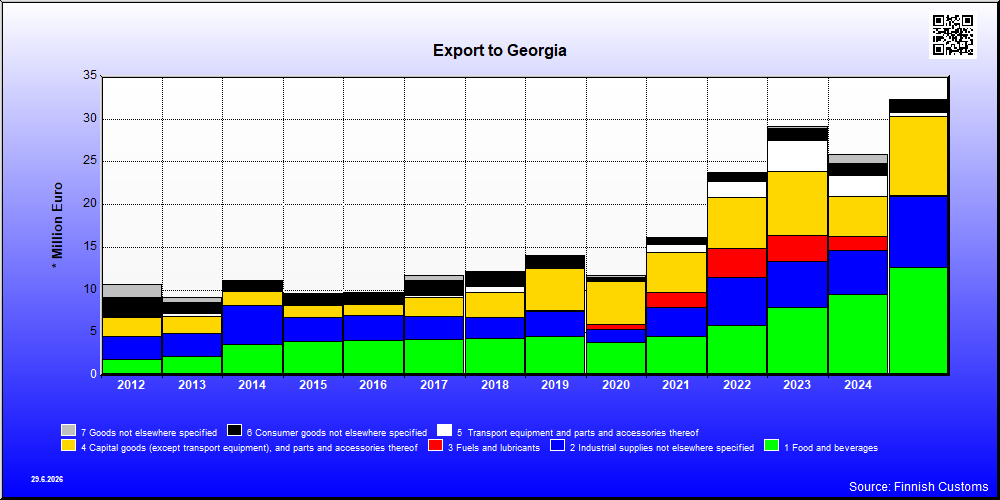
| 2021 | 2022 | 2023 | 2024 | 2025 | ||||||
|---|---|---|---|---|---|---|---|---|---|---|
| 1,000 € | % | 1,000 € | % | 1,000 € | % | 1,000 € | % | 1,000 € | % | |
| 1. Food and beverages | 4,548 | 28.1 | 5,816 | 24.5 | 7,975 | 27.3 | 9,470 | 36.6 | 12,638 | 39.1 |
| 11. Food and beverages, primary | 8 | 0.0 | 8 | 0.0 | 34 | 0.1 | ||||
| 112. Food and beverages, primary, mainly for household consumption | 8 | 0.0 | 8 | 0.0 | 34 | 0.1 | ||||
| 12. Food and beverages, processed | 4,540 | 28.0 | 5,808 | 24.5 | 7,975 | 27.3 | 9,470 | 36.6 | 12,604 | 39.0 |
| 121. Food and beverages, processed, mainly for industry | 81 | 0.5 | 378 | 1.6 | 609 | 2.1 | 859 | 3.3 | 1,212 | 3.8 |
| 122. Food and beverages, processed, mainly for household consumption | 4,459 | 27.5 | 5,430 | 22.9 | 7,366 | 25.2 | 8,611 | 33.3 | 11,392 | 35.3 |
| 2. Industrial supplies not elsewhere specified | 3,391 | 20.9 | 5,640 | 23.8 | 5,336 | 18.3 | 5,206 | 20.1 | 8,363 | 25.9 |
| 21. Industrial supplies not elsewhere specified, primary | 2 | 0.0 | 3 | 0.0 | 6 | 0.0 | 1 | 0.0 | ||
| 22. Industrial supplies not elsewhere specified, processed | 3,389 | 20.9 | 5,637 | 23.7 | 5,336 | 18.3 | 5,201 | 20.1 | 8,362 | 25.9 |
| 3. Fuels and lubricants | 1,806 | 11.2 | 3,463 | 14.6 | 3,102 | 10.6 | 1,577 | 6.1 | 90 | 0.3 |
| 32. Fuels and lubricants, processed | 1,806 | 11.2 | 3,463 | 14.6 | 3,102 | 10.6 | 1,577 | 6.1 | 90 | 0.3 |
| 321. Fuels and lubricants, motor spirit | 1,552 | 9.6 | ||||||||
| 322. Fuels and lubricants, other | 254 | 1.6 | 3,463 | 14.6 | 3,102 | 10.6 | 1,577 | 6.1 | 90 | 0.3 |
| 4. Capital goods (except transport equipment), and parts and accessories thereof | 4,668 | 28.8 | 5,947 | 25.0 | 7,423 | 25.4 | 4,732 | 18.3 | 9,169 | 28.4 |
| 41. Capital goods (except transport equipment) | 3,732 | 23.0 | 4,189 | 17.6 | 5,355 | 18.3 | 4,006 | 15.5 | 8,313 | 25.7 |
| 42. Capital goods (except transport equipment), parts and accessories | 936 | 5.8 | 1,758 | 7.4 | 2,068 | 7.1 | 726 | 2.8 | 856 | 2.6 |
| 5. Transport equipment and parts and accessories thereof | 922 | 5.7 | 1,884 | 7.9 | 3,726 | 12.8 | 2,387 | 9.2 | 506 | 1.6 |
| 51. Passenger motor vehicles | 462 | 1.9 | 578 | 2.0 | 173 | 0.7 | 20 | 0.1 | ||
| 52. Transport equipment, other than passenger motor vehicles | 893 | 5.5 | 1,301 | 5.5 | 2,127 | 7.3 | 2,123 | 8.2 | 434 | 1.3 |
| 521. Transport equipment, other than passenger motor vehicles, industrial | 824 | 5.1 | 80 | 0.3 | 36 | 0.1 | 235 | 0.9 | 157 | 0.5 |
| 522. Transport equipment, other than passenger motor vehicles, non-industrial | 69 | 0.4 | 1,221 | 5.1 | 2,091 | 7.2 | 1,888 | 7.3 | 277 | 0.9 |
| 53. Transport equipment, parts and accessories | 29 | 0.2 | 121 | 0.5 | 1,021 | 3.5 | 91 | 0.4 | 52 | 0.2 |
| 6. Consumer goods not elsewhere specified | 813 | 5.0 | 979 | 4.1 | 1,385 | 4.7 | 1,486 | 5.7 | 1,411 | 4.4 |
| 61. Consumer goods not elsewhere specified, durable | 104 | 0.6 | 222 | 0.9 | 414 | 1.4 | 477 | 1.8 | 41 | 0.1 |
| 62. Consumer goods not elsewhere specified, semi-durable | 30 | 0.2 | 189 | 0.8 | 224 | 0.8 | 393 | 1.5 | 200 | 0.6 |
| 63. Consumer goods not elsewhere specified, non-durable | 679 | 4.2 | 568 | 2.4 | 748 | 2.6 | 616 | 2.4 | 1,169 | 3.6 |
| 7. Goods not elsewhere specified | 45 | 0.3 | 16 | 0.1 | 254 | 0.9 | 1,005 | 3.9 | 136 | 0.4 |
| All groups | 16,193 | 100.0 | 23,746 | 100.0 | 29,201 | 100.0 | 25,863 | 100.0 | 32,314 | 100.0 |
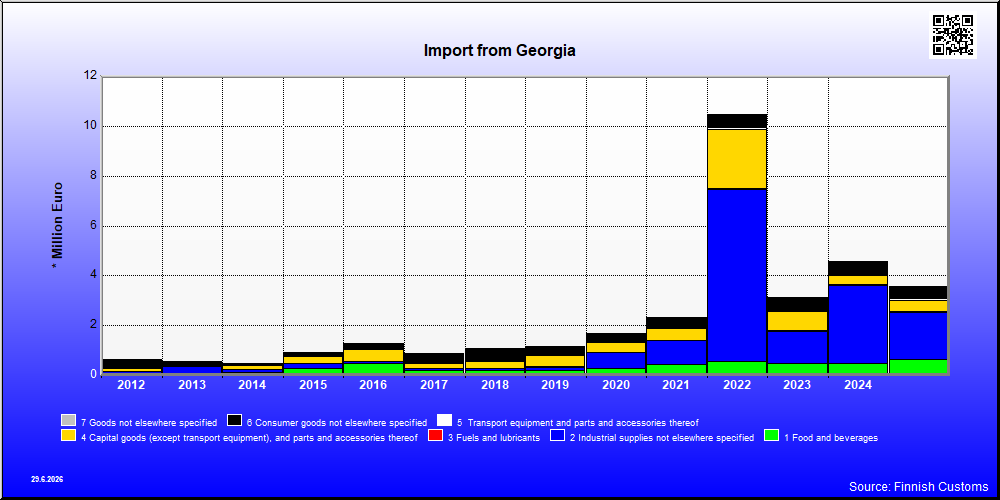
| 2021 | 2022 | 2023 | 2024 | 2025 | ||||||
|---|---|---|---|---|---|---|---|---|---|---|
| 1,000 € | % | 1,000 € | % | 1,000 € | % | 1,000 € | % | 1,000 € | % | |
| 1. Food and beverages | 436 | 18.6 | 575 | 5.5 | 494 | 15.8 | 490 | 10.7 | 661 | 18.6 |
| 11. Food and beverages, primary | 16 | 0.7 | 111 | 1.1 | 134 | 4.3 | 49 | 1.1 | 18 | 0.5 |
| 111. Food and beverages, primary, mainly for industry | 5 | 0.1 | ||||||||
| 112. Food and beverages, primary, mainly for household consumption | 16 | 0.7 | 111 | 1.1 | 129 | 4.1 | 49 | 1.1 | 18 | 0.5 |
| 12. Food and beverages, processed | 420 | 17.9 | 464 | 4.4 | 360 | 11.5 | 441 | 9.6 | 643 | 18.1 |
| 121. Food and beverages, processed, mainly for industry | 6 | 0.3 | 8 | 0.3 | 1 | 0.0 | 1 | 0.0 | ||
| 122. Food and beverages, processed, mainly for household consumption | 414 | 17.7 | 464 | 4.4 | 351 | 11.3 | 441 | 9.6 | 641 | 18.0 |
| 2. Industrial supplies not elsewhere specified | 963 | 41.1 | 6,904 | 65.8 | 1,261 | 40.4 | 3,126 | 68.3 | 1,874 | 52.7 |
| 21. Industrial supplies not elsewhere specified, primary | 97 | 4.2 | 6,032 | 57.5 | 619 | 13.5 | 864 | 24.3 | ||
| 22. Industrial supplies not elsewhere specified, processed | 865 | 37.0 | 872 | 8.3 | 1,261 | 40.4 | 2,508 | 54.8 | 1,011 | 28.4 |
| 3. Fuels and lubricants | 24 | 1.0 | 31 | 0.3 | 39 | 1.2 | 55 | 1.2 | 38 | 1.1 |
| 32. Fuels and lubricants, processed | 24 | 1.0 | 31 | 0.3 | 39 | 1.2 | 55 | 1.2 | 38 | 1.1 |
| 321. Fuels and lubricants, motor spirit | 17 | 0.7 | ||||||||
| 322. Fuels and lubricants, other | 6 | 0.3 | 31 | 0.3 | 39 | 1.2 | 55 | 1.2 | 38 | 1.1 |
| 4. Capital goods (except transport equipment), and parts and accessories thereof | 462 | 19.7 | 2,348 | 22.4 | 775 | 24.9 | 330 | 7.2 | 453 | 12.7 |
| 41. Capital goods (except transport equipment) | 249 | 10.6 | 2,048 | 19.5 | 415 | 13.3 | 192 | 4.2 | 303 | 8.5 |
| 42. Capital goods (except transport equipment), parts and accessories | 213 | 9.1 | 299 | 2.9 | 360 | 11.5 | 139 | 3.0 | 150 | 4.2 |
| 5. Transport equipment and parts and accessories thereof | 34 | 1.5 | 93 | 0.9 | 58 | 1.9 | 47 | 1.0 | 81 | 2.3 |
| 51. Passenger motor vehicles | 49 | 0.5 | 2 | 0.1 | 2 | 0.0 | ||||
| 53. Transport equipment, parts and accessories | 34 | 1.5 | 44 | 0.4 | 58 | 1.9 | 45 | 1.0 | 80 | 2.3 |
| 6. Consumer goods not elsewhere specified | 378 | 16.2 | 496 | 4.7 | 480 | 15.4 | 523 | 11.4 | 445 | 12.5 |
| 61. Consumer goods not elsewhere specified, durable | 2 | 0.1 | 11 | 0.1 | 3 | 0.1 | 30 | 0.7 | 2 | 0.0 |
| 62. Consumer goods not elsewhere specified, semi-durable | 114 | 4.8 | 173 | 1.6 | 138 | 4.4 | 143 | 3.1 | 90 | 2.5 |
| 63. Consumer goods not elsewhere specified, non-durable | 263 | 11.2 | 312 | 3.0 | 339 | 10.9 | 350 | 7.7 | 353 | 9.9 |
| 7. Goods not elsewhere specified | 44 | 1.9 | 39 | 0.4 | 11 | 0.4 | 3 | 0.1 | 2 | 0.0 |
| All groups | 2,341 | 100.0 | 10,486 | 100.0 | 3,118 | 100.0 | 4,575 | 100.0 | 3,553 | 100.0 |
| Classification | Description | Year level | Quarter level | Month level | |
|---|---|---|---|---|---|
| SITC | Standard International Trade Classification (classification system is maintained by the United Nations) | ███ | ███ | ███ | |
| BEC | The standard of statistical classification of BEC (Broad Economic Categories) is upheld by the UN and it is based on SITC-nomenclature. | ███ | ███ | ███ | |
| NACE | National industrial classification based on Statistical Classification of Economic Activities in the European Community Nomenclature générale des Activités économiques dans les Communautés européennes | ███ | ███ | ███ | |
| CPA | CPA = Classification of Products by Activities | ███ | ███ | ███ | |
| CN | The Combined Nomenclature is the common nomenclature of the European Community. | ███ | ███ | ███ |