
| Export of goods from Finland and import to Finland | BEC (Broad Economic Categories) |
*) The standard of statistical classification of BEC (Broad Economic Categories) is upheld by the UN and it is based on SITC-nomenclature.

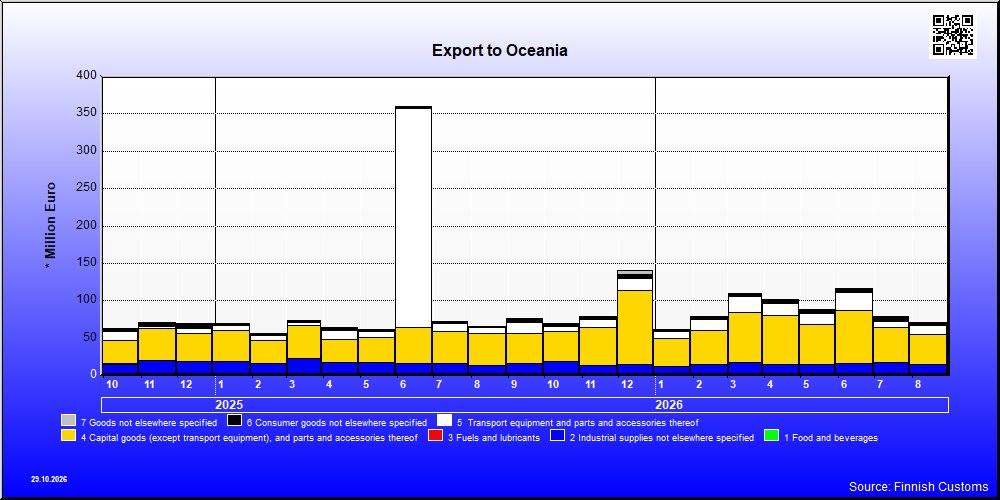
| 8 / 2026 | 8 / 2025 | Change from previous year's equal month % | ||
|---|---|---|---|---|
| 1,000 € | % | 1000 € | ||
| 1. Food and beverages | 1,481 | 2.1 | 1,201 | 23.3 |
| 11. Food and beverages, primary | 2 | 0.0 | 1 | 33.8 |
| 111. Food and beverages, primary, mainly for industry | 2 | 0.0 | 0 | 631.7 |
| 112. Food and beverages, primary, mainly for household consumption | 0 | 0.0 | 1 | -76.4 |
| 12. Food and beverages, processed | 1,479 | 2.1 | 1,200 | 23.3 |
| 121. Food and beverages, processed, mainly for industry | 57 | 0.1 | 21 | 165.0 |
| 122. Food and beverages, processed, mainly for household consumption | 1,422 | 2.0 | 1,179 | 20.7 |
| 2. Industrial supplies not elsewhere specified | 13,161 | 18.7 | 11,616 | 13.3 |
| 21. Industrial supplies not elsewhere specified, primary | 475 | 0.7 | 225 | 111.6 |
| 22. Industrial supplies not elsewhere specified, processed | 12,685 | 18.0 | 11,391 | 11.4 |
| 3. Fuels and lubricants | 53 | 0.1 | 18 | 192.5 |
| 31. Fuels and lubricants, primary | 52 | 0.1 | 0 | .. |
| 32. Fuels and lubricants, processed | 1 | 0.0 | 18 | -97.1 |
| 322. Fuels and lubricants, other | 1 | 0.0 | 18 | -97.1 |
| 4. Capital goods (except transport equipment), and parts and accessories thereof | 40,036 | 57.0 | 43,634 | -8.2 |
| 41. Capital goods (except transport equipment) | 32,181 | 45.8 | 37,479 | -14.1 |
| 42. Capital goods (except transport equipment), parts and accessories | 7,855 | 11.2 | 6,155 | 27.6 |
| 5. Transport equipment and parts and accessories thereof | 12,565 | 17.9 | 7,965 | 57.8 |
| 52. Transport equipment, other than passenger motor vehicles | 12,326 | 17.5 | 7,087 | 73.9 |
| 521. Transport equipment, other than passenger motor vehicles, industrial | 12,325 | 17.5 | 6,937 | 77.7 |
| 522. Transport equipment, other than passenger motor vehicles, non-industrial | 1 | 0.0 | 150 | -99.2 |
| 53. Transport equipment, parts and accessories | 239 | 0.3 | 878 | -72.8 |
| 6. Consumer goods not elsewhere specified | 2,584 | 3.7 | 1,285 | 101.2 |
| 61. Consumer goods not elsewhere specified, durable | 1,151 | 1.6 | 177 | 550.3 |
| 62. Consumer goods not elsewhere specified, semi-durable | 1,075 | 1.5 | 767 | 40.1 |
| 63. Consumer goods not elsewhere specified, non-durable | 358 | 0.5 | 340 | 5.2 |
| 7. Goods not elsewhere specified | 409 | 0.6 | 298 | 37.2 |
| All groups | 70,288 | 100.0 | 66,016 | 6.5 |

| 8 / 2026 | 8 / 2025 | Change from previous year's equal month % | ||
|---|---|---|---|---|
| 1,000 € | % | 1,000 € | ||
| 1. Food and beverages | 3,604 | 2.1 | 2,035 | 77.1 |
| 11. Food and beverages, primary | 1,118 | 0.6 | 440 | 154.2 |
| 111. Food and beverages, primary, mainly for industry | 25 | 0.0 | 0 | .. |
| 112. Food and beverages, primary, mainly for household consumption | 1,092 | 0.6 | 440 | 148.4 |
| 12. Food and beverages, processed | 2,486 | 1.4 | 1,595 | 55.9 |
| 121. Food and beverages, processed, mainly for industry | 2 | 0.0 | 0 | .. |
| 122. Food and beverages, processed, mainly for household consumption | 2,484 | 1.4 | 1,595 | 55.8 |
| 2. Industrial supplies not elsewhere specified | 146,837 | 84.2 | 1,908 | .. |
| 21. Industrial supplies not elsewhere specified, primary | 145,176 | 83.2 | 113 | .. |
| 22. Industrial supplies not elsewhere specified, processed | 1,660 | 1.0 | 1,795 | -7.5 |
| 3. Fuels and lubricants | 18,941 | 10.9 | 1,992 | 850.7 |
| 31. Fuels and lubricants, primary | 18,930 | 10.9 | 1,991 | 850.8 |
| 32. Fuels and lubricants, processed | 11 | 0.0 | 1 | 726.1 |
| 322. Fuels and lubricants, other | 11 | 0.0 | 1 | 726.1 |
| 4. Capital goods (except transport equipment), and parts and accessories thereof | 3,040 | 1.7 | 2,306 | 31.8 |
| 41. Capital goods (except transport equipment) | 2,199 | 1.3 | 1,709 | 28.7 |
| 42. Capital goods (except transport equipment), parts and accessories | 841 | 0.5 | 598 | 40.8 |
| 5. Transport equipment and parts and accessories thereof | 225 | 0.1 | 424 | -46.9 |
| 51. Passenger motor vehicles | 0 | 0 | 53 | .. |
| 52. Transport equipment, other than passenger motor vehicles | 0 | 0.0 | 296 | -99.9 |
| 521. Transport equipment, other than passenger motor vehicles, industrial | 0 | 0.0 | 0 | .. |
| 522. Transport equipment, other than passenger motor vehicles, non-industrial | 0 | 0.0 | 296 | -100.0 |
| 53. Transport equipment, parts and accessories | 225 | 0.1 | 74 | 202.7 |
| 6. Consumer goods not elsewhere specified | 430 | 0.2 | 482 | -10.7 |
| 61. Consumer goods not elsewhere specified, durable | 121 | 0.1 | 206 | -41.2 |
| 62. Consumer goods not elsewhere specified, semi-durable | 94 | 0.1 | 74 | 27.5 |
| 63. Consumer goods not elsewhere specified, non-durable | 216 | 0.1 | 203 | 6.3 |
| 7. Goods not elsewhere specified | 1,384 | 0.8 | 1,566 | -11.6 |
| All groups | 174,462 | 100.0 | 10,713 | .. |
| Classification | Description | Year level | Quarter level | Month level | Year 2026 sofar |
|---|---|---|---|---|---|
| SITC | Standard International Trade Classification (classification system is maintained by the United Nations) | ███ | ███ | ███ | ███ |
| BEC | The standard of statistical classification of BEC (Broad Economic Categories) is upheld by the UN and it is based on SITC-nomenclature. | ███ | ███ | ███ | ███ |
| NACE | National industrial classification based on Statistical Classification of Economic Activities in the European Community Nomenclature générale des Activités économiques dans les Communautés européennes | ███ | ███ | ███ | ███ |
| CPA | CPA = Classification of Products by Activities | ███ | ███ | ███ | ███ |
| CN | The Combined Nomenclature is the common nomenclature of the European Community. | ███ | ███ | ███ | ███ |